By Anson Bouchard and David Mathias

Looking at fiscal data from the Congressional Budget Office (CBO) and news indices developed by Baker, Bloom and Davis , we explore this question by tracking the fiscal deficit compared with news attention regarding it. We cyclically adjust the CBO fiscal deficit, meaning it has been modified to remove the effects of the business cycle and temporary fiscal swings. We then compare it to the media attention data, which are news indices that track the mention of certain terms in US newspapers. We use the terms that fall under the following categories: fiscal policy and government spending, entitlement programs, and taxes.
To explore the relationship between media attention and the fiscal deficit, we have made two graphs. These show that media attention and the fiscal deficit are mostly inversely correlated, from which we can infer that the media feel that fiscal policy, taxes, and entitlements are topics of greater public interest when the deficit is relatively large.
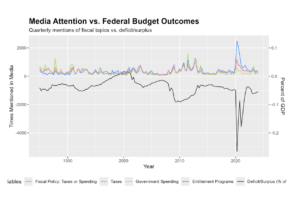
Our first graph analyzes the correlation between various media categories and the federal budget outcomes. Since the different media categories are highly correlated, we use the average media mentions in the rest of our analysis.
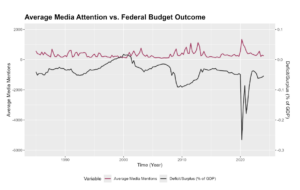
The second graph, using the average of all the terms, highlights that when there are greater deficits, the media attention usually proportionally increases to cover that deficit. To measure the evolving relationship between media coverage and the fiscal deficit, we included a time trend in our regression model. We found that, holding deficits constant, each passing year is associated with a 0.5245 index point decline in our media attention index. But deficits have not been constant – in fact, they have been rising. When we invert this relationship, it becomes clear that increasingly larger deficits are now required to generate the same level of media attention. The news index is normalized to have a mean of 100 over the span of 1985 to 2024, so the 0.5245 index points may appear modest in magnitude. However, because the trend is statistically significant, we can conclude that the decline is systemic and meaningful over time. This supports the existence of a long-run relationship between time and reduced media sensitivity to deficits.
It is also important to note that the time period we are looking at can effectively be partitioned into two sections: 1985-2000 and 2001-2024. From 1985 until 2000, the fiscal deficit to GDP ratio decreased from a deficit of 5% to a surplus of 2.3%. However, from 2001 to 2024, the fiscal deficit to GDP ratio increased from a surplus of 2% to a deficit of 6.4%. Before 2000, media attention increased most around 1987 and 1992 and the overall trend was a declining deficit. After 2000, news attention did increase around the times when the deficit was increasing the most – in 2008 during the Great Recession and 2020 during Covid-19. However, after these larger events, attention fades and returns to its baseline, seemingly indicating that attention to these issues is short lived in our rapid news cycle. This could signal that people are accepting a higher deficit since they get used to change and do not pay persistent attention. The rebound of the fiscal deficit to GDP ratio after the Great Recession was to -2.8% in 2015, however, now five years after Covid, the rebound is only at -6.4%. This shows an acceptance of a higher deficit as we fail to even return to baseline. In other words, media attention only follows larger and larger deficits, pointing to the fact that the current deficits are being accustomed to. Another way to explain this is that whilst our deficit is worsening, there is not as large media attention as there used to be for deficits of that size. To test the statistical effect of this visual observation, we ran another regression starting from 2001. Our results indicate that, holding all else fixed, a $1 billion improvement in the federal deficit is associated with a predicted decrease in news attention by 0.8613 index points in the same year. Running the same regression for the first period from 1985 until 2000 gives us the results that, holding all else fixed, a $1 billion improvement in the federal deficit is associated with a predicted decrease in news attention by 1.329 index points in the same year. This relationship suggests that while media coverage responds to worsening financial deficits in the short run post 2000, its responsiveness has declined compared to the period of 1985 to 2000. The fact that the attention in the secondary period has a decreased effect could point to a greater disregard of the deficit’s potential negative consequences by members of both parties. Why there should be such a sharp shift in the relationship between deficits and media attention around the turn of the millennium remains a puzzle.
Even as the old theory of needing to maintain a balanced budget has been replaced by a newer model where some debt is still considered healthy, it is uncertain whether we are starting to approach the upper bounds of a healthy debt-to-GDP ratio that is being fuelled by increasing deficits. As this becomes more unprecedented, it could pose significant risk for the domestic and global economy. Thus far, there has been no precedent of a developed economy like the US defaulting on its debt, making it uncertain as to what the consequences would be. Comparisons, for example to Japan, which has a debt-to-GDP ratio of around 250%, are not as informative due to the Japanese government’s ability to rely on domestic household savings and the US position as the reserve currency4. Because of this, the fact that the US issues debt in its own currency, and that its treasuries serve as reserves around the world, make the possible consequences for the US even harder to determine, but probably significantly more important. In 2010, a paper by economists Reinhart and Rogoff titled “Growth in a Time of Debt” claimed that a debt-to-GDP ratio of over 90 percent would lead to lower growth outcomes in economically advanced countries5. However, this was debunked shortly afterwards by economists at Amherst, and when accounting for programming errors and data omissions, advanced countries were projected to have a positive economic growth of 2.2% with a debt-to-GDP ratio of 90% or more6. In sum, it remains uncertain what the exact effects of the increasing debt-to-GDP ratio will be, but that does not preclude the possible disastrous effects it could have domestically and globally.
 |
Article by Anson Bouchard ’26 and David Mathias ’25 Data Journalists |
|
Data Sources
1: https://www.npr.org/2025/03/14/nx-s1-5328229/senate-spending-bill-vote-government-shutdown#:~:text=Senate%20advances%20plan%20to%20avert%20shutdown%2C%20in%20vote%20that%20exposes%20Democratic%20rifts&text=President%20Trump%20signed%20into%20law,who%20almost%20unanimously%20opposed%20it.
2: https://fiscaldata.treasury.gov/americas-finance-guide/national-deficit/
3: https://fiscaldata.treasury.gov/americas-finance-guide/national-debt/
4: https://www.imf.org/external/datamapper/d@FPP/USA/FRA/JPN/GBR/SWE/ESP/ITA/ZAF/IND; https://www.stlouisfed.org/on-the-economy/2023/nov/what-lessons-drawn-japans-high-debt-gdp-ratio
5: https://scholar.harvard.edu/files/rogoff/files/growth_in_time_debt_aer.pdf
6: https://www.newyorker.com/news/john-cassidy/the-reinhart-and-rogoff-controversy-a-summing-up
Intro:
https://fiscaldata.treasury.gov/americas-finance-guide/national-deficit/
https://fiscaldata.treasury.gov/americas-finance-guide/national-debt/
Data + Graphs:
Baker, Bloom, Davis Data: https://www.policyuncertainty.com/bbd_monetary.html
CBO data: https://www.cbo.gov/data/budget-economic-data#2
https://fred.stlouisfed.org/series/FYFSDFYGDP
Conclusion:
https://www.imf.org/external/datamapper/d@FPP/USA/FRA/JPN/GBR/SWE/ESP/ITA/ZAF/IND; https://www.stlouisfed.org/on-the-economy/2023/nov/what-lessons-drawn-japans-high-debt-gdp-ratio
https://scholar.harvard.edu/files/rogoff/files/growth_in_time_debt_aer.pdf
https://www.newyorker.com/news/john-cassidy/the-reinhart-and-rogoff-controversy-a-summing-up