Are Opportunity Zones in Los Angeles County Well-Targeted to Impoverished Areas?
In recent weeks, a federal tax incentive aimed at encouraging investment in low-income and disadvantaged communities has come under scrutiny by Senate Democrats. Introduced in the 2017 Tax Cuts and Jobs Act, Opportunity Zones seemed positioned to benefit both investors and targeted low-income communities. Now, there are questions not only about whether the policy is skewed to the benefit of the wealthy, but whether the policy is effective at all.
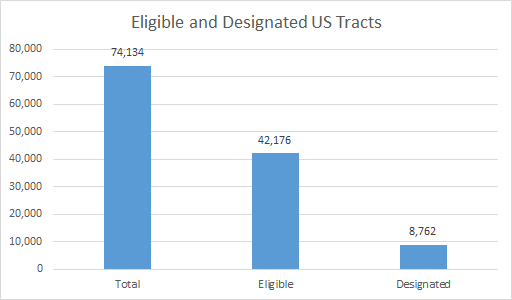
Of the total 74,134 U.S. census tracts, 42,176 (57%) were eligible for Opportunity Zone designation. Tracts were considered eligible low-income communities if their poverty rates were at least 20 percent or median family incomes did not exceed 80 percent of the area median. Tracts adjacent to these communities were also considered eligible so long as their median family income did not exceed 125 percent of the bordered low-income tract though adjacent tracts were not allowed to account for more than 5 percent of selected tracts (Theodos, B., Meixell, B., & Hedman, C., 2019). Governors of the 50 states, governors of territories, and the mayor of D.C. then nominated and the US Department of Treasury then designated 8,762 of these tracts as Opportunity Zones.
Investors are incentivized to invest in properties located inside these zones through Opportunity Funds. Participation in Opportunity Funds allows investors to defer taxes on any capital gains they contribute and pay no taxes on capital gains that the fund returns after 10 years. Investors can continue to enjoy these benefits so long as 90% of the Opportunity Fund’s assets are Opportunity Zone properties. In principle, Opportunity Zones direct gains that would otherwise be paid in taxes to communities in need of capital. Yet, the policy is currently structured in a way that allows for practice deviating from this principle.
The main cause for concern is the lack of transparency. As funds are only required to report financial information to the IRS and not information about specific investments, difficulty lies in assessing whether these projects are returning any social benefit (Belova, 2019). There is currently little information indicating whether Opportunity Funds are investing in local businesses or high-end condos. Another concern is the fact that Opportunity Zones are based on 2010 census data. Many of the communities once considered low-income have since gone through or are continuing to go through significant socio-economic changes (Drucker, J., & Lipton, E., 2019). In the areas where these changes are displacing low-income community members, outside investment may exacerbate the problem.
As it stands, there is little the government can do to monitor Opportunity Fund activity within Opportunity Zones. However, governors and the mayor of D.C. had the authority to restrict Funds to zones where there is the least margin for questionable investment behavior and the greatest possibility for positive social benefit. Tracts were automatically eligible if they met certain statistical criteria, but governors were responsible for selecting and not selecting the Opportunity Zones.
Analysis by the Urban Institute found that there was some targeting towards socio-economically disadvantaged communities with less access to capital, but this analysis was done at the national level, which raises the question: how much did this targeting vary between states and counties (Theodos, B., Meixell, B., & Hedman, C., 2019)? In communities where such deviation occurred, it is in the public’s interest to know by how much and for what reason.
Another Urban Institute study assessed the fairness of Opportunity Zone designation in the San Francisco Bay Area (Theodos, B., & Meixell, B., 2018). They found that 15 of the 80 tracts in the area (18.8%) were already experiencing significant socioeconomic change according to their own proxy measure for gentrification. Surprisingly, a similar assessment of Southern California Opportunity Zones has not been discussed. The 80 eligible tracts in the San Francisco Metropolitan Area (San Francisco, San Mateo, Alameda, Contra Costa, and Marin counties) represent 5.08% of all tracts in California. The 1,740 eligible tracts in the Los Angeles Metropolitan Area (Los Angeles and Orange counties) represent 21.60% with Los Angeles County’s 1,368 eligible tracts alone representing 17.0%.
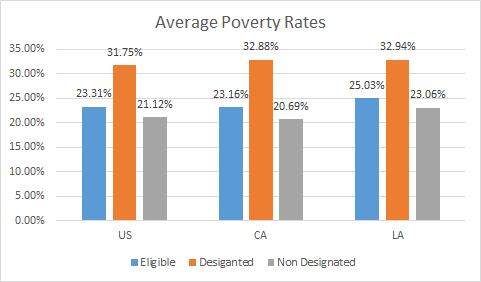
Using nation, state, and county-level poverty rate data, the Lowe Institute assessed the effectiveness of Opportunity Zone designation in Los Angeles County. Encouragingly, the average poverty rate of designated Opportunity Zones was 32.94%, 7.91 percentage points higher than the average 25.03% poverty rate of eligible tracts. Similar outcomes are seen at the national and state level. The data indicate that governors designated zones with poverty rates far above the minimum requirement of their respective areas, which supports the Urban Institute hypothesis that governors did tend to appropriately target communities of greater need.
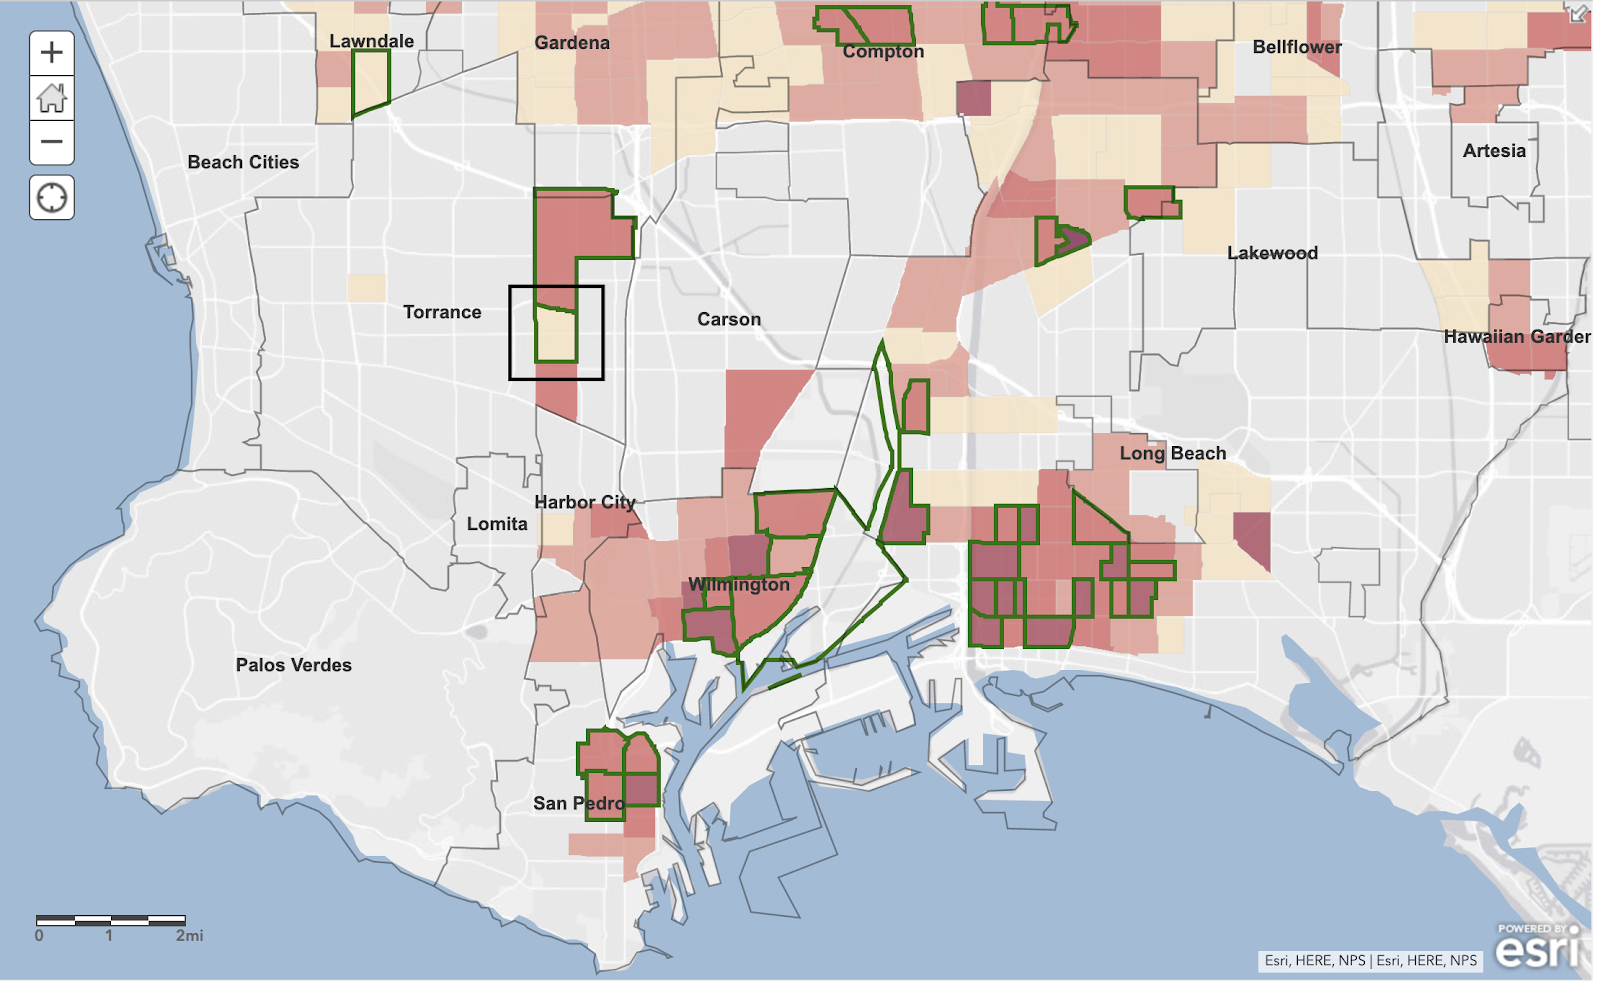
Below is a map of eligible census tracts in Los Angeles County shaded by poverty rate. Areas of darker shades had higher 2010 poverty rates. The census tracts with green borders are those that were designated as Opportunity Zones. One can quickly see that opportunity zones are remarkably closely targeted to the pockets of poverty in LA County.
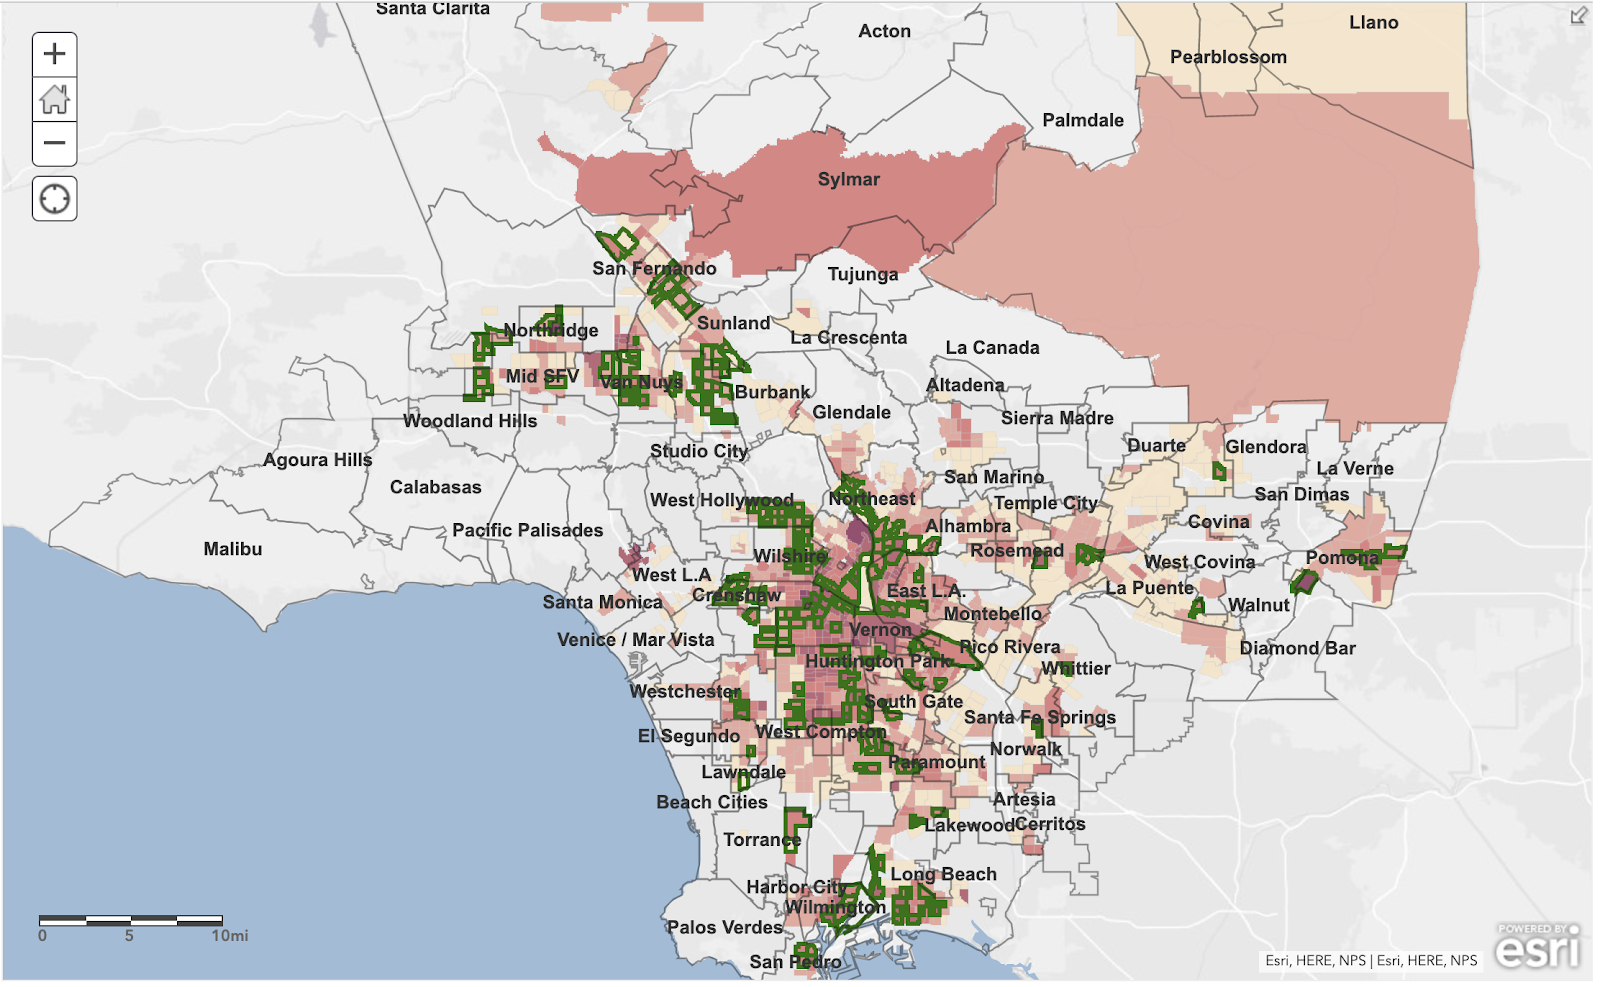
An interactive version of the map is accessible here
A closer look shows that some of the deviations from this close targeting are nonetheless consistent with the purpose of the program. Take for instance, the designated tract that was least impoverished and the non-designated tract that was most impoverished. There is a clear logic to each of these choices.
The designated Opportunity Zone with the lowest 2010 poverty rate is census tract 293201 (black box in the map below). This tract, on the border of Torrance and Carson, had a poverty rate of 11.2% in 2010. It is zoned mixed residential and commercial, thus offering a range of investment possibilities, and is one of the few eligible tracts in proximity to two higher poverty tracts.
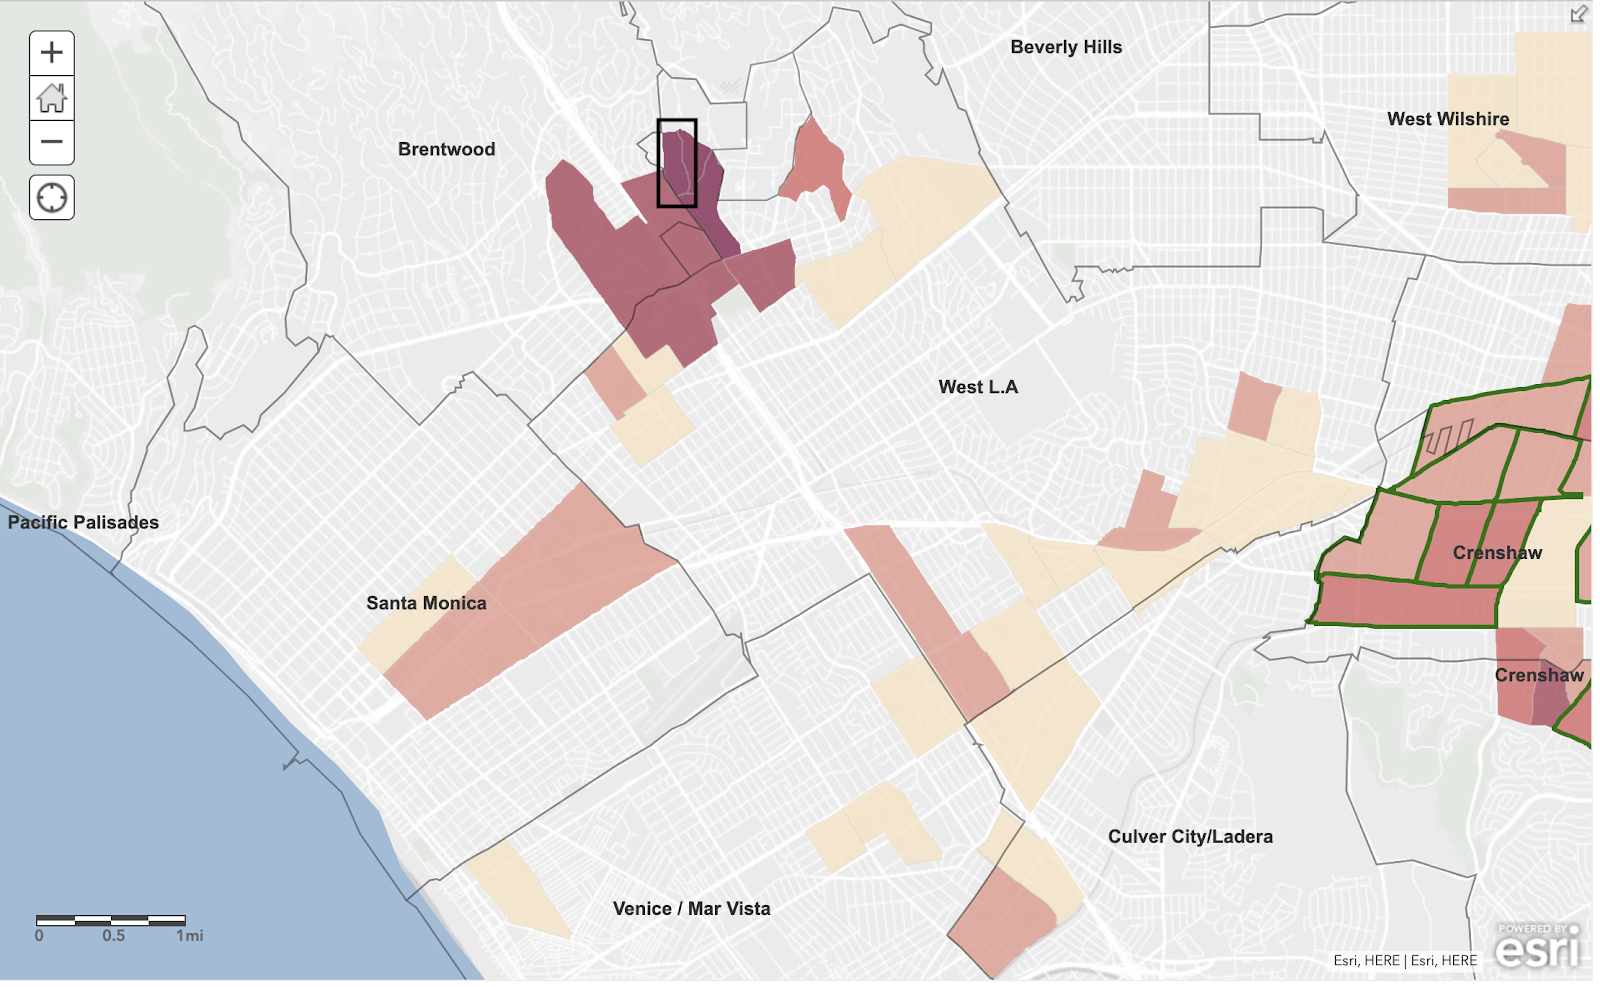
On the flip-side, the non-designated eligible census tract with the highest 2010 poverty rate is tract 265303 (black box in the map above). This tract, bordering Brentwood, had a poverty rate of 76.8% in 2010. Brentwood is a well known upper-class neighborhood in Los Angeles but the dense cluster of apartment buildings in the area is likely occupied by UCLA students. While meeting the definition of low-income, they live in the area for the few years they are in college and have strong prospects upon graduation.
Between the broader map and investigation of specific tracts, the opportunity zones chosen in Los Angeles County would seem to be well targeted to the purpose of the program.
References:
Belova, I. (2019, August 20). Avoiding Gentrification, How to Use Opportunity Zones to Benefit Communities. https://fusecorps.org/2019/02/12/avoiding-gentrification-how-to-use-opportunity-zones-to-benefit-communities/.
Drucker, J., & Lipton, E. (2019, August 31). How a Trump Tax Break to Help Poor Communities Became a Windfall for the Rich. https://www.nytimes.com/2019/08/31/business/tax-opportunity-zones.html.
Theodos, B., & Meixell, B. (2018, July 12). Assessing Governor Brown’s selections for Opportunity Zones in the Bay Area. https://www.urban.org/urban-wire/assessing-governor-browns-selections-opportunity-zones-bay-area.
Theodos, B., Meixell, B., & Hedman, C. (2019, January 3). Did States Maximize Their Opportunity Zone Selections? https://www.urban.org/research/publication/did-states-maximize-their-opportunity-zone-selections.