Could a cap-and-trade market-based climate approach be the answer to climate policy?

Article by Marisa Mestichella.
President Biden has promised America an extensive climate agenda. His mission is to transition the economy to net-zero emissions by 2050 and have 100% renewable energy for electricity generation by 2035. Regulation of this magnitude, while ambitious, leads some to “worry that stricter regulations could hurt companies struggling to recover from the pandemic, which decimated demand for fuel” (Bussewitz and Krisher, 2021). The challenge — finding a balance between adopting climate policies that are environmentally rigorous and economically affordable for companies — is not new. Previously proposed solutions include market-based approaches. In this article, we explore the market-based carbon cap-and-trade policy implemented across many states in 2005 and study its effect on carbon emissions.
Stavins (2020) states that there is widespread agreement among economic policy analysts that national-level carbon-pricing policies could effectively achieve large reductions of CO2 emissions in the long run. There are two main forms of economy-wide carbon pricing: a carbon tax and a cap-and-trade program. Stavins (2020) characterizes these as “functionally similar, with differences in specific designed elements.” A carbon tax sets a price per ton of CO2 that a company releases into the atmosphere. Cap-and-trade, on the other hand, puts an overall limitation on greenhouse gas emissions, which gets more stringent over time, while allowing companies to trade emitter allowances. A typical cap-and-trade sets an overall target ‘cap’ on total emissions, allocating a certain number or auctioning pollution permits for polluting companies. This incentivizes organizations to reduce their emissions in order to avoid having to buy more permits or to sell their excess emission allowances to companies facing higher costs.
To explore the effect of market-based climate change policies and the cap-and-trade policy in particular, we collect data for 21 states on metric tons of energy-related carbon dioxide per chained 2012 million dollars of state level GDP from 2000 to 2018. We also collect annual data on population, unemployment rate, and median household income for each state. The data are from the Energy Information Administration (EIA), the Center for Climate and Energy Solutions, FRED Economic Data, and the Bureau of Labor Statistics.
The states included in the analysis are Maine, Delaware, New Hampshire, New York, Maryland, Arizona, Florida, Ohio, Alabama, Washington, California, Rhode Island, Vermont, Virginia, Pennsylvania, New Jersey, Connecticut, Massachusetts, Oregon, North Carolina, and Nevada. We selected these states because they cover a range of states included in the Regional Greenhouse Gas Initiative (RGGI), which implemented cap-and-trade in 2005, as well as several states that did not implement cap-and-trade or opted for different types of climate policies. The bolded states above implemented cap-and-trade in 2005, except for California, which implemented it later.
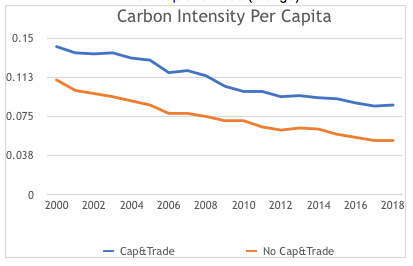
Our variable of interest is carbon intensity per capita. Figure 1 plots carbon intensity per capita over time. The blue color represents the average for states that implemented cap-and-trade policies in 2005 and the orange color represents the average for states that never implemented the policy. Apparent from the figure is the downward trend for both groups and that the cap-and-trade states have higher per capita emissions throughout the sample. We observe a kink in 2005 for the cap-and-trade states, possibly due to the policy change. Otherwise, these lines appear to have similar slopes before and after the policy.
Figure 1: Average carbon intensity per capita for states with cap-and-trade (blue) and states without cap-and-trade (orange)
To model these data, and control for income and employment effects, we develop a panel fixed effect regression approach and interact a cap-and-trade indicator variable with time variables for before and after the policy was implemented. The model controls for employment, median household income, and time invariant characteristics for each state. The results for cap-and-trade were negative and statistically significant, meaning that the cap-and-trade policy reduces carbon intensity per capita.
The effect, however, is quite small. As with Figure 1, we do not see dramatic carbon changes resulting from the policy. When considering these results, it’s important to note that while there is evidence that cap-and-trade does reduce carbon intensity, we also don’t have controls for many other energy policies that happen across the states during this timeline. Hence, anything else that comes into play around 2005 will also get picked up in our outcome variable of carbon intensity per capita.
These results suggest that for substantive climate change improvements to occur, cap-and-trade policies cannot be the only solution to greenhouse gas emissions; in order to be most effective, they should be implemented in conjunction with other climate policies and across several sectors. Stock and Stuart (2021) agree that “to reliably achieve deep decarbonization of the US power sector, a candidate policy must perform robustly across a range of possible future trajectories of demand, fossil fuel prices, and prices of new wind and solar capacity.” They bring up two additional robust policy options: tradable performance standards (TPS) and hybrid Clean Electricity Standards (CES) with a target goal of 100% clean energy.
Cap-and-trade, as well as other new climate policy standards, may be challenging for the Biden administration to pass through an evenly divided Senate – especially since Republican Senators typically lean away from cap-and-trade policies as they increase costs for businesses (Arnold, 2014). Still, an end to the bipartisan gap for a progressive national climate policy agreement may be on the horizon.
California’s recent cap-and-trade policy, passed in 2013 and expanded in 2017, has created a platform for cap-and-trade advocates to set a new political trend for broader bi-partisan support in the climate crisis. Following this, “in 2019, carbon pricing legislation was introduced in 16 states, and that number is expected to continue growing in the coming years” (Wincele, 2019). This drive for more market-based climate strategies will create a bandwidth for more substantial impact from cap-and-trade policies on a national level while also making it more feasible for the Biden administration to pass a cohesive climate plan through a divided Senate.
Sources:
Bussewitz and Krisher (2021): Biden’s climate steps could have big impact on energy firms
Stavins (2020): The Future of US Carbon-Pricing Policy
Hafstead (2021): Federal Climate Policy 102: Economy-Wide Policies
Environmental Defense Fund: How Cap and Trade Works
Mason and Megerian (2017): With Rare Bipartisan Climate Support, California Extends Its Cap-and-Trade Program
Arnold (2014): GOP Demonizes Once Favored Cap-And-Trade Policy
Wincele (2019): Cap-and-Trade ambition renewed in 2019 after a decade of decline
Stock and Stuart (2021): Robust Decarbonization of the US Power Sector: Policy Options