Trump’s Threats Have No Impact on Chinese Import-Exports in L.A Ports
Much media and political attention has been given to the U.S.-China trade war and speculation about its effect on both economies. General economic intuition would predict the tariffs to have a negative effect on exports and imports leaving and entering U.S. However, data from the L.A. ports points to a different narrative. In this article, we try to get at some of the reasons as to why the effect was not what was expected.
Data source: Port of Los Angeles (https://www.portoflosangeles.org/business/statistics/container-statistics)
Data source: Port of Los Angeles (https://www.portoflosangeles.org/business/statistics/container-statistics)
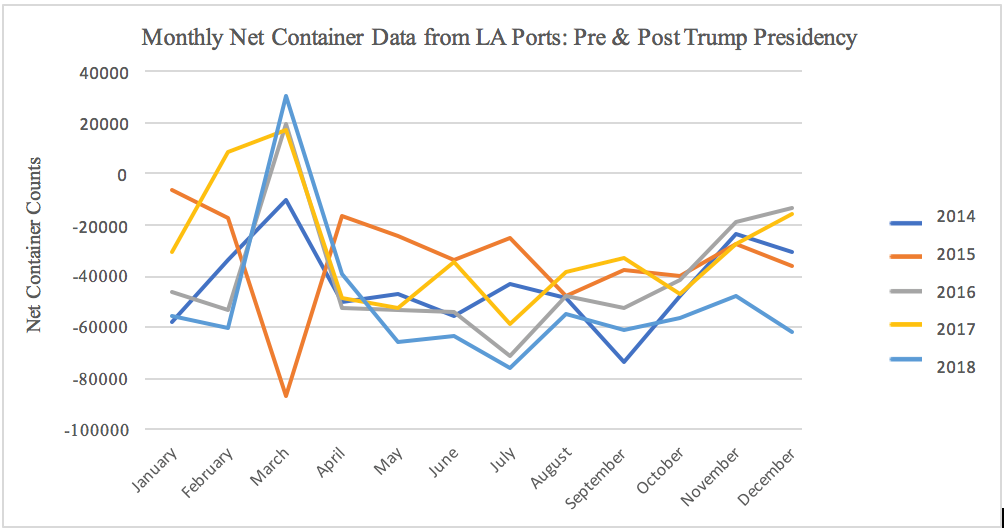
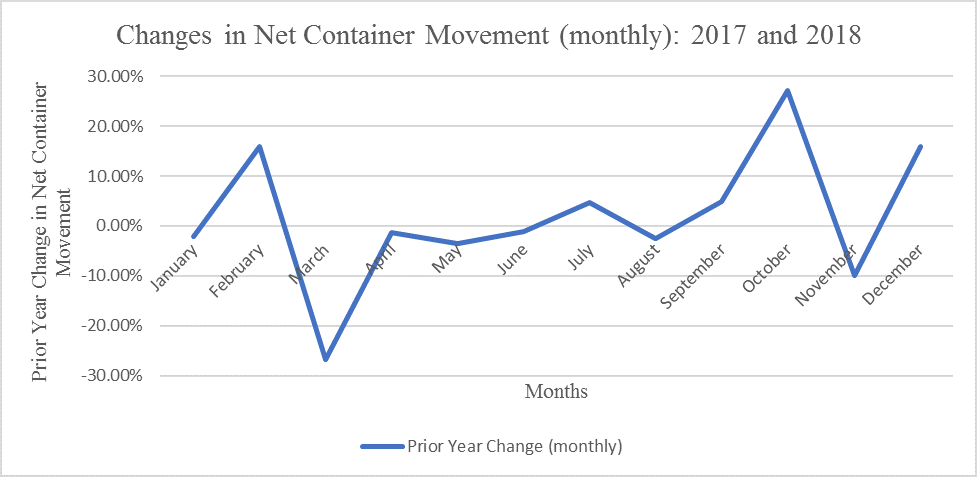
The above graph depicts net containers from the LA ports pre- and post-Trump presidency. The years of the Trump Administration, 2017 and 2018, follow similar net container movement trends as the years before the Trump presidency, 2014, 2015, and 2016. On the whole, the net change in container movement between 2017 (pre-tariff) and 2018 (post-announcement and imposition) was a mere -0.39%. Once we dig a little deeper, as the above the graph shows, the most volatile months were February, March, October, and December. We argue that the container movements were sensitive to updates from the administration and responded to them by essentially hoarding more containers before the tariffs went into effect. To this point, on February 16, the U.S. Department of Commerce presented several options to impose tariffs that were largely imposed on China. It is in the same month that we see a sharp increase (15.94%) of net container movement into the L.A. ports. We see the biggest drop in net container movement on March, after the 03/08/2018 tariffs went into effect. The net container movement steadily decreased at a low rate (less than 3.50%) till June 2018, a possible response to China’s March 1, 2018 tariffs and the failed U.S.-China negotiations. Lastly, the largest gains in September (27.22%) and December (15.92%) can be explained by Trump’s threats to hike the tariff rate from 10% to 25% in September and Trump’s December announcement to delay the raise in tariff rates until after the Washington-Beijing talks. In summary, we hypothesize that the net container movement through the L.A. ports remains relatively unchanged because of the inventory adjustment following Trump’s threats i.e., the 2018 flows were relatively similar to that of 2017, just more volatile and responsive to tariff announcements.
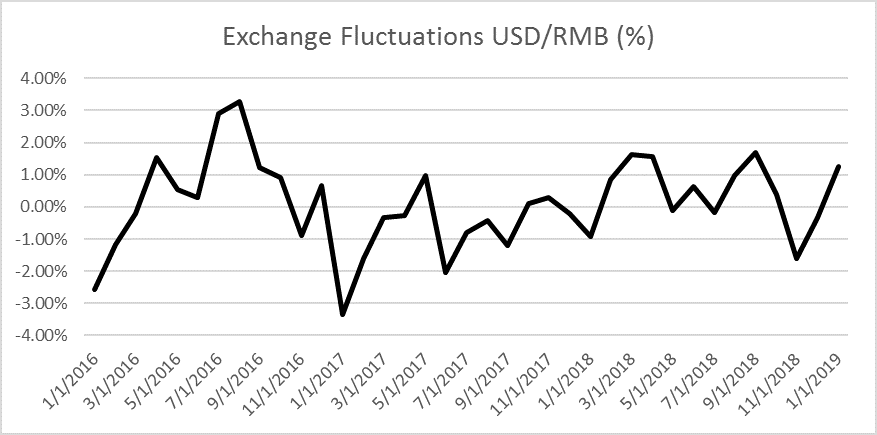
Net containers in 2018 were slightly lower than previous years, but that can be explained by fluctuations in the USD/RMB exchange rate. The beginning of Trump tariffs on US imports from China started on 22 January 2018 which was followed by an escalation by Trump on 8 March 2018 resulting in counter-escalation by China on 1 April 2018. As we can see, no major deviation from previous years’ trends (2014 through 2016) seem to neatly fit this timeline. Thus we are left with the question: why have net containers from LA ports been surprisingly unaffected by the trade war?
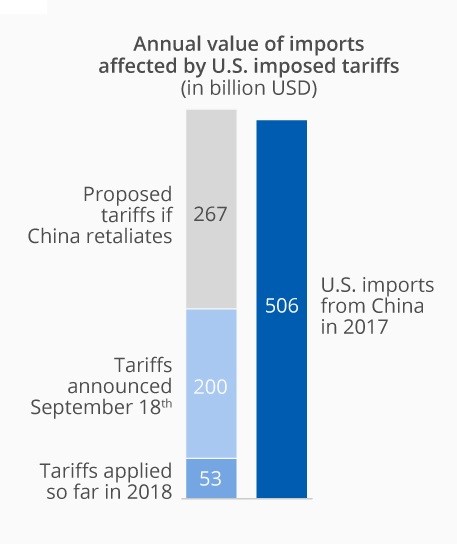
Another possible reason for the relative lack of effect: actual tariffs on Chinese goods have fallen far short of what Trump threatened on the campaign trail and as President. As of March 2019, the Trump administration has not levied the increased tariff rate, from 10% to 25%, that was proposed in March 2018 as a measure to counter China’s retaliation. Although the administration has threatened to increase tariff rates on specific products like “Apple iPhones and laptops”, the threats are yet to translate into actual tariffs. Whether or not these threats will materialize depends on the outcome of the ongoing negotiations between U.S. and China.
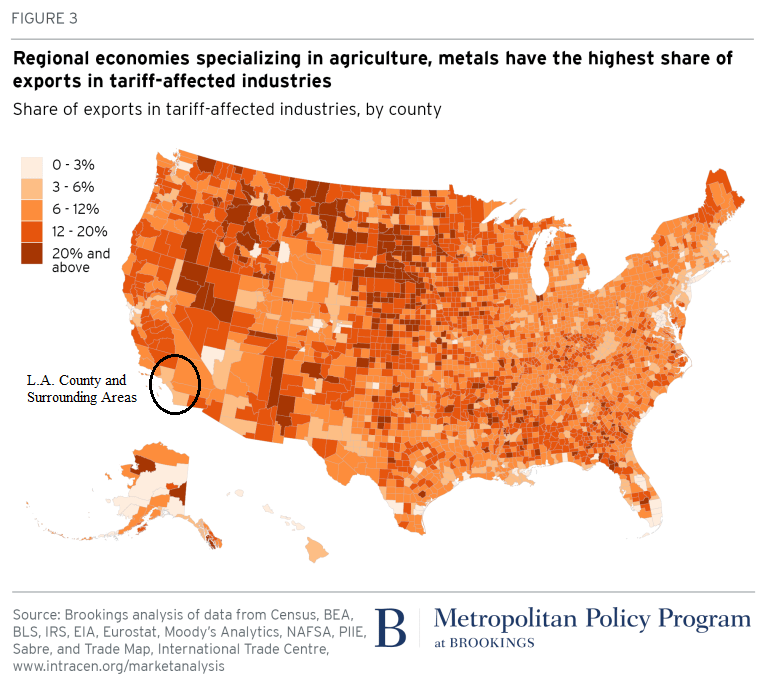
A third reason for the relative stability of exports and imports through the L.A. ports despite the tariffs and threats is that the goods being shipped in and out of LA ports are not those hardest hit by the tariffs. What started as a trade war on 18 products has, by 2019, grown to include over 10,000 products. However, it might be possible that these tariffs don’t hit the goods being produced and shipped through the L.A. ports. The graph from Brookings’ Metropolitan Policy Program, indicating regions within the U.S. that are most exposed to the imposed tariffs corroborates that L.A. county and surrounding areas have a relatively low exposure to the administration’s tariffs. However, without precise data about the contents of containers, it is hard to calculate precise values.
It is also possible that inventories and anticipatory adjustment are delaying the impact of the tariffs. In December 2018, imports from China to the US fell 3.7 which marked the first off-season decline in imports since October 2016. The lag between the announcement of the mid-September tariff and the effect of the tariffs on the container flow explains the purchasing rush from China. This increased US exports to China by 10.3% over the 3 months from September 2018 to November 2018 after which China’s imports from the US declined 35.8% in December 2018. Thus, effects of the trade war only started to have an impact in exports and imports in December of 2018. Current data from the flow of containers through the LA ports will not show the full impact of the tariffs on the economy unless the trade war continues.
Lastly, trade dispute saw the Renminbi fall 5% in 2018, raising afresh the old concern that China might be depreciating its currency to boost exports. China has already devalued their currency, in July 2018 the People’s Bank of China dropped the RMB/USD exchange rate by 0.9%. Meanwhile the Fed’s raising interest rates makes the dollar stronger and U.S. exports less attractive. With a weakened RMB and a stronger dollar, exports from China become more attractive to US consumers. However, as of February, China’s currency has stabilized leading to the notion that currency stabilization was one of the key elements in the negotiations between the two countries.
In summary, despite pessimistic outlooks for U.S. trade post the U.S-China trade war, Los Angeles Port data show that things don’t look so bad for LA country! Not only did the tariffs not have a significant effect on the net container movement in the LA port, the goods produced in the county have not been the target of these tariffs. Simply put, the data from the L.A. Port and the graph below show that not only what is shipped, but also what is produced in the LA County was relatively lightly hit.