Food Stamp Distribution Among CA Counties
At 6.7 million, the number of food-insecure Californians in 2019 tops the population of 86 different countries. A person is defined as food insecure if they lack consistent access to enough food for an active and healthy lifestyle. Almost all California counties have food insecurity rates between 10 and 18 percent. The problem is not one of food production–it is simply one of poverty. After paying expensive California rent, many struggle to pay the grocery bills. Non-profit food banks and government services alike work to curb the problem suffered by both housed and homeless populations. Specifically, Supplemental Nutrition Assistance Program (SNAP, formerly food stamps) is a federal program run by the USDA, the distribution of which is managed by each state’s Division of Social Services. California’s SNAP program is known as CalFresh. In August 2018, about 3.8 million Californians received CalFresh benefits, which come in the form of a debit card recipients can use at most grocery stores. 3.8 million accounts for about 10 percent of the Americans on SNAP.
Generally, a strong economy translates into a lower percentage of the population receiving CalFresh benefits as employment rates and incomes rise. But other negative factors may suppress the number of CalFresh recipients, such as lack of awareness or impatience with the registration process. Unlike many states, California implements SNAP programs by county. This raises the question: how effectively do the 58 California counties implement CalFresh to reach those in need? Do counties suffer from bureaucratic inefficiencies resulting in inefficient publicity campaigns or registration? Do counties vary in their customer service, potentially discouraging would-be recipients from registering?
To determine whether any counties display these symptoms, we plotted data from the 58 California counties, with CalFresh participation on the vertical axis and mean income on the horizontal axis.
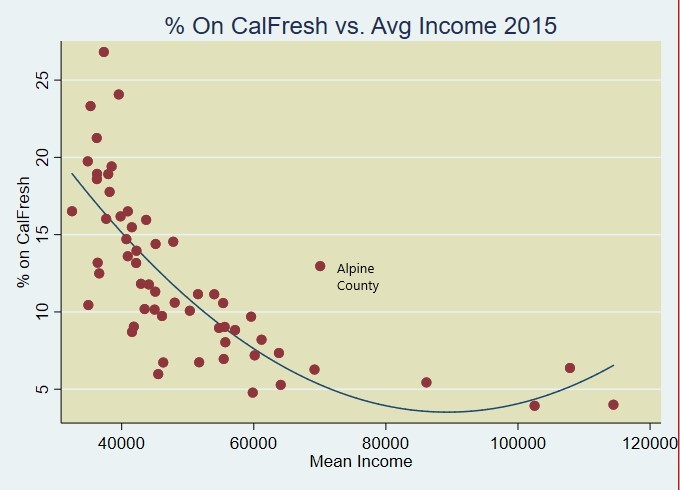
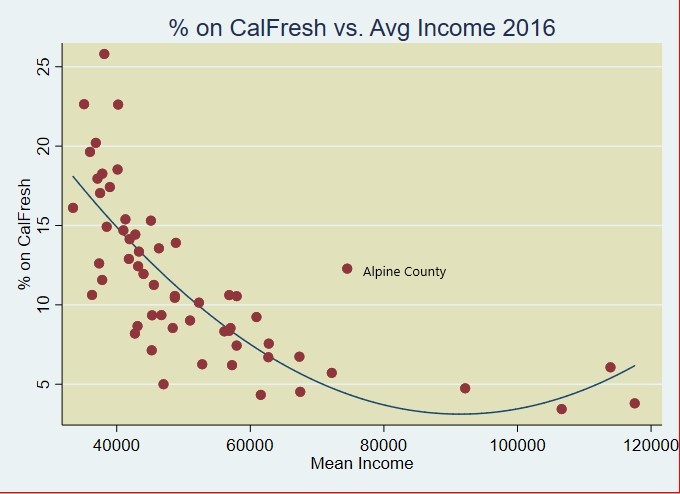
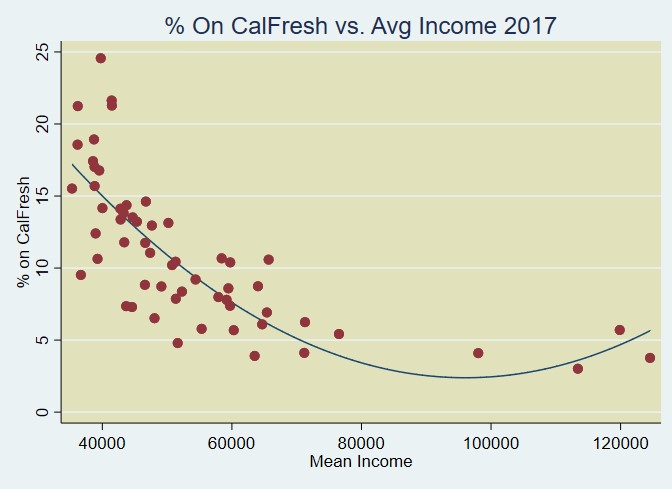
These three scatterplots show that CalFresh participation by California county is closely predicted by the county’s mean income. This indicates that the different counties are fairly standard in their implementation of CalFresh, ensuring that the number of recipients matches that county’s economic need. The only major outlier in 2015 and 2016 is Alpine County. With Alpine County’s mean income of around $74,000 in these years, the regression would predict many fewer CalFresh recipients. Critically, though, with a population of 1,057 in 2016, Alpine County’s mean income may have been drastically influenced by a few extremely wealthy individuals. In fact, after 2016, Alpine County’s mean income dropped immensely, from $74,512 to $65,673, and in 2017, it fit much closer onto the regression line.
We then plotted counties’ CalFresh participation percentages against unemployment rates:
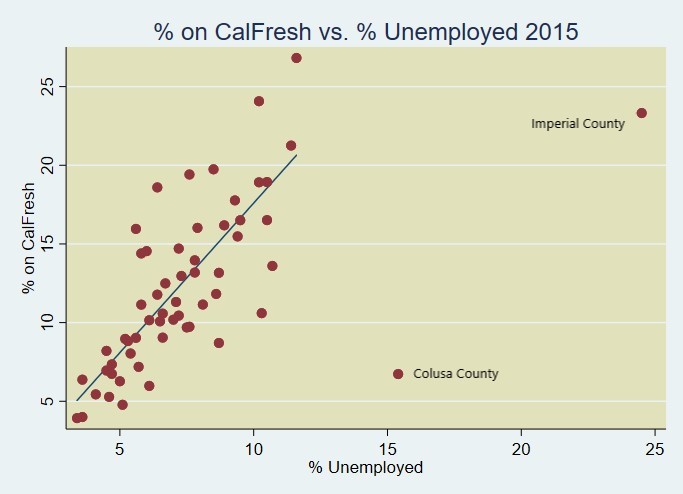
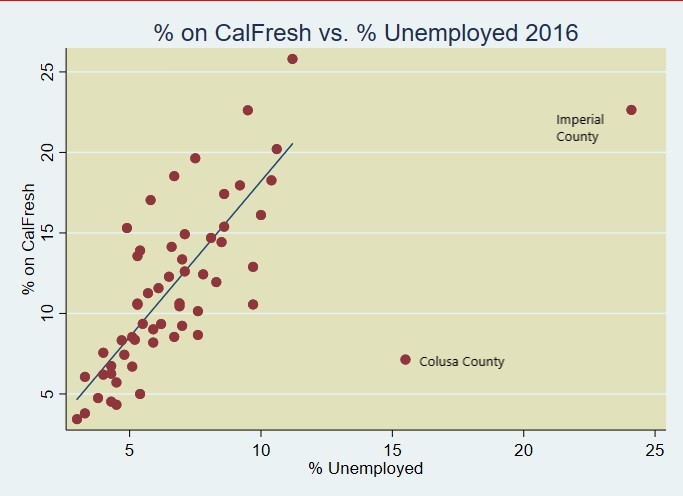
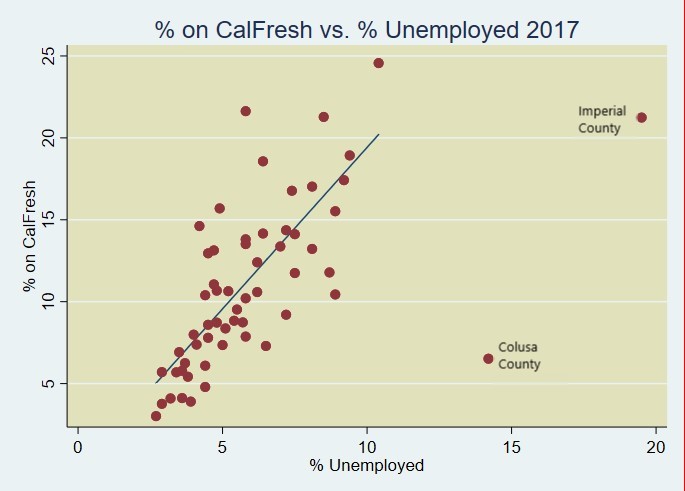
Here, the plots show a strikingly linear relationship, except for two marked outliers: Colusa County and Imperial County. Both counties are mainly agricultural and majority Hispanic/Latino. Their unemployment rates consistently dwarf the rest of California, and their CalFresh numbers do not keep up. Imperial and Colusa have about 80 percent and 53 percent Hispanic/Latinos respectively, some of the highest percentages in the state. For Imperial especially, which lies on the Mexican border, the high immigrant population could present both awareness and eligibility problems. Most non-citizens who are otherwise eligible for SNAP must wait five years before getting SNAP benefits. SNAP, however, does allow parents of U.S. citizens to register their children for benefits no matter their own immigration status. Furthermore, Colusa and Imperial are especially reliant on seasonal agriculture, making many residents temporarily unemployed for a significant block of the year. For Able-Bodied Adults Without Dependents (ABAWD’s) who are unemployed at the time of application, temporary or otherwise, SNAP benefits are limited to 3 months every 36-month period. Also, federal SNAP regulation requires recipients to report income at least twice a year, and if a former recipient is above the income limit on one of those reports, their benefits are terminated. This disproportionately affects communities with high rates of seasonal agriculture because a seasonal farm worker’s income and employment status is relatively unstable, and may be prone to both troughs and peaks. It has been shown that highly agricultural counties terminate CalFresh benefits at a higher rate. It seems Colusa and Imperial’s problems, therefore, are likely rooted in those counties’ labor situations and the overarching federal SNAP regulations. The reason for their outlier status remains a mystery, however, as counties like Fresno, Tulare and Kern are also dominantly agricultural and have large Hispanic/Latino populations. The only conclusively unique trait of Colusa and Imperial is their long history of topping California’s unemployment rankings.
As a federal program, SNAP’s eligibility information widely available online, but California counties are responsible for all brick and mortar operations and case-by-case eligibility determinations. Therefore, the strong relationship across counties between economic health indicators and CalFresh participation suggests a commendable level of operational consistency.
Works Cited:
1. https://cfpa.net/2019-food-insecurity-factsheet/
2. https://www.countyhealthrankings.org/app/california/2016/measure/factors/139/data
3. https://www.globalcitizen.org/en/content/food-insecurity-los-angeles-california/
4. https://www.fns.usda.gov/snap/recipient/eligibility
5. https://factfinder2.census.gov/
7. https://onlinelibrary.wiley.com/doi/epdf/10.1093/ei/40.1.12
CalFresh Data: CA Department of Social Services
Unemployment Data: bls.gov
Income Data: bea.gov