
By Sol Kim and Tony Pappas
The legacy of redlining continues to shape the American landscape—not just in housing patterns, but in the economic trajectories of families across generations. In a political climate where spatial inequality increasingly defines opportunity, we examine whether federal redlining maps, originally designed to restrict credit access in minority neighborhoods, still predict economic mobility today.
In the 1930s, the Home Owners’ Loan Corporation (HOLC) graded neighborhoods across U.S. cities on their perceived creditworthiness, often marking Black, immigrant, and low-income areas as “hazardous” thereby excluding them from mortgage lending. While redlining has long been studied in terms of housing access and segregation, we ask a deeper question: do the long-term effects of redlining influence intergenerational social mobility?
To evaluate this, we use data from the Opportunity Atlas, which measures upward mobility as the average income percentile rank in adulthood for individuals who grew up in low-income households. Low-income status is defined as having parents whose household income ranks around the 25th percentile nationally. By focusing only on individuals from similar starting points, the measure captures differences in adulthood outcomes that can be attributed to place rather than to initial socioeconomic status.
We merge this data with tract-level redlining scores from the 2020 Historical Redlining Index (HRI2020), which assign a score ranging from 0 to 4. Our dataset includes over 84,000 census tracts across the U.S., of which approximately 14,000 are historically redlined. A score of 0 means the tract was not graded at all by HOLC, often because it was developed post-1930s or outside city boundaries at the time. Because our analysis focuses on the impact of HOLC grading, we exclude tracts with a score of 0 and restrict our focus to the 14,000 neighborhoods that received a HOLC designation between Grades 1 and 4. A higher number indicated the neighborhood was deemed less suitable for loans. To isolate the relationship between redlining and mobility, we group tracts by HRI score and plot the average income percentile rank in adulthood, including 95% confidence intervals.
Although HOLC’s active grading efforts ended by the 1940s and the agency itself was dissolved in 1954, the maps it produced continued to shape lending practices and neighborhood investment patterns for decades afterward. The neighborhoods shaped by these policies remained economically and socially distinct long after redlining officially ended.
The cohort observed in the Opportunity Atlas consists of individuals born between 1978 and 1983, whose income outcomes are measured around age 35. Thus, the effects observed reflect the lasting influence of historical neighborhood conditions rather than a direct experience of federal redlining practices.
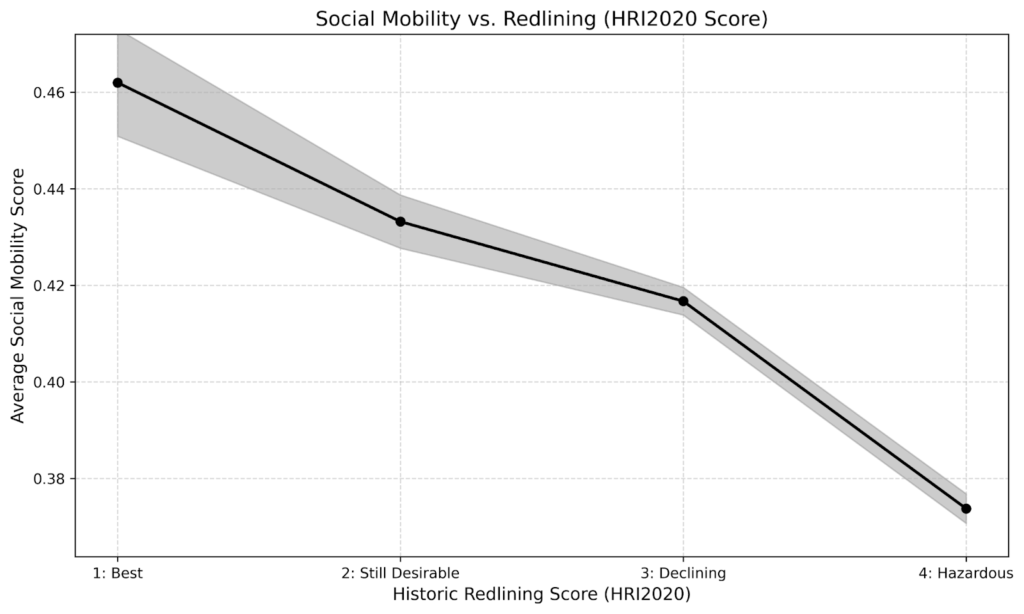
The results show a clear and continuous decline in economic mobility as redlining severity increases. Children from formerly “Best” (Grade 1) or ungraded tracts experience higher upward mobility than those from “Hazardous” (Grade 4) areas. On average, children from tracts with more favorable HOLC grades experience a 5–7 percentile advantage in future income rank compared to those from “Hazardous” areas.
While tract-level economic and demographic changes have occurred over the decades, the durable association between HOLC maps and present-day opportunity reflects the role of place-based exclusion. Redlining’s effects persist not only through disinvestment, but also through concentrated poverty, under-resourced schools, and limited access to social capital.
These patterns suggest plausible pathways through which the legacy of redlining continues to shape economic outcomes today. By restricting mortgage access and lowering property values, redlining reduced the tax base available to fund local services, particularly schools. As a result, schools in historically redlined neighborhoods may have had fewer academic opportunities, limited support systems, and fewer resources overall. Concentrated poverty likely compounded these disadvantages, weakening community institutions and reducing access to the networks that help support upward mobility. Although our data do not directly measure these mechanisms, the observed patterns are consistent with a broader structure of opportunity shaped by historical exclusion.
This finding fits into a broader conversation about the role of the environment in shaping economic outcomes. Scholars like Richard Rothstein argue that historical government policies created lasting structural barriers that still constrain opportunity today, while economists like Edward Glaeser emphasize that contemporary policies, such as exclusionary zoning, now play a greater role in perpetuating spatial inequality.
Our results suggest that historical and contemporary mechanisms interact to reinforce spatial inequality. Place-based disadvantage, rooted in past injustices such as redlining, continues through ongoing patterns of disinvestment and exclusion. Addressing gaps in economic mobility will require confronting both the legacy of redlining and the modern policies that shape access to opportunity today.
  |
Article by Sol Kim ’27 and Tony Pappas ’27 Data Journalists |