By Ishita Gupta and Leonora Willett
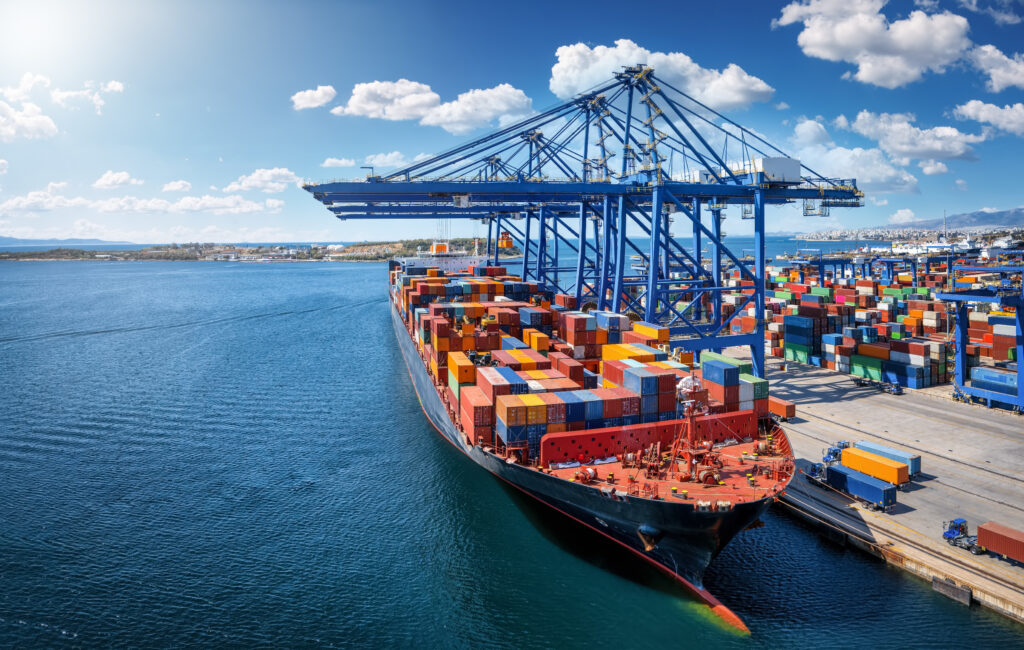
The Port of Long Beach, located just south of Los Angeles, California, handles more than 9 million container units annually, generating more than 50,000 jobs in the area and serving as a hub for imports worldwide.1 The Port plays an important role in the local economy and also operates as a gateway for trans-Pacific trade. From February 1, 2025 to the present, President Trump has raised tariffs against U.S. trade partners, especially China. In February, there was a 10% baseline tariff on all goods. By April 9th, tariffs on Chinese goods reached 145%.2 This article explores the impact of President Trump’s proposed tariffs on container ship port activity by analyzing passthrough from import growth rates.
China is the largest source of imports for Long Beach, accounting for 62% of all goods. Most of the containers processed at the port contain furniture, automobile parts, apparel, electronics, and recyclable plastics.3 Beginning in the 1970’s, the U.S. began a trade partnership with China that would fundamentally reshape American manufacturing and the greater economy. China entered into the World Trade Organization in 2001, which normalized trade relations between the U.S. and China. While the U.S. benefited from importing cheaper goods, the “China Shock” led to more than 1 million American manufacturing job losses.4 Amid these disruptions to the American manufacturing labor force, the surge in Chinese imports led to the Port of Long Beach establishing itself as a critical hub for goods flowing into the U.S. economy.
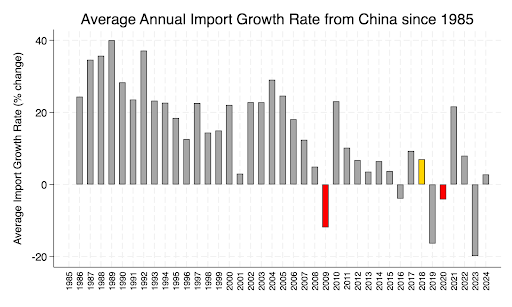
As shown in the figure below, from the late 90’s into the 2000’s, before the 2008 financial crisis (denoted in red in 2008), the annual import growth rate from China remained steady. Amid a backdrop of stable trade relations, companies steadily built trans-Pacific trade into their supply chains. However, in the past 10 years, there has been a significant variation in the imports coming from China, partly due to Trump’s tariffs in 2018 (the yellow bar) and the global COVID pandemic (denoted in red in 2020). This highlights the sensitivity of port activity to external shocks, including trade policy.
There is great uncertainty regarding what will happen as a result of Trump’s tariffs against China. Using data from the Port of Long Beach and the U.S. Census, we forecast the impact of a decrease in the import growth rate from China on total port activity in Long Beach. To estimate the pass-through effect of a decrease in import growth on container traffic, we first assume that enacting tariffs, regardless of the percent, is going to negatively impact the import growth rate from China. Facing higher prices, consumers will demand less for these goods, and thus imports coming from China will decrease, and total port activity in Long Beach will decrease. Some of the decline in imports from China may be offset by trade diversion, as U.S. firms shift sourcing to other Asian countries whose goods could continue to flow through the Port of Long Beach, partially replacing the lost volume from China.5 Given this uncertainty, we model moderate to severe trade shocks at 5%, 10%, 20%, and 50% declines in Chinese import growth to capture a realistic range of potential outcomes.
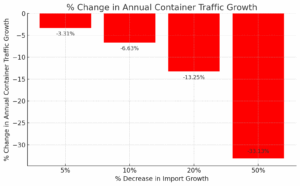
We estimate that a 5% decrease in import growth leads to a 3.31% decline in annual container traffic growth, while 10%, 20%, and 50% decreases result in drops of 6.63%, 13.25%, and 33.13% respectively. These projections are visualized below in Figure 2. Figure 2 reveals a proportional relationship, where larger drops in import growth lead to proportionally larger losses in port activity. The graph highlights the consistent effect of import shocks on container traffic, suggesting that extreme trade restrictions can severely disrupt logistical operations.
Prior to the start of the additional tariffs in April 2025, the Port of Long Beach reported a 26.6% increase in shipping containers, making it the nation’s busiest port.6 This increase likely comes from manufacturers preparing for a decrease in shipments once Trump’s tariffs were in effect.7 This recent increase in port activity is likely to be short-lived, as the current 145% tariffs placed on China is likely going to result in a tremendous decrease in port activity.
These effects will not only be felt in Long Beach, but also in the greater U.S. economy. If the tariffs remain enacted, the effects could rival that of the China Shock, only this time, not just manufacturing jobs will be impacted.8 On the local level, 1 in 5 jobs in Long Beach are associated with the Port, meaning that a dramatic decrease in shipping activity at the Port could result in severe job losses.9 Assuming job losses are proportional to the decline in containers coming into the port, our estimates suggest that if the country sees a 20% decrease in imports from China, we could expect to see a 13.25% decrease in jobs (roughly 6,885 jobs in the Long Beach area). On a larger scale, retailers, farmers, automakers, tech companies, in addition to manufacturers, will all be forced to adapt to the changing supply chain as a result of these tariffs.
- Facts at a Glance – Port of Long Beach
- U.S. and China Headed for ‘Monumental’ Split, Putting World Economy on Edge – The New York Times
- Container Statistics – The Port of Los Angeles
- Q&A: David Autor on the long afterlife of the “China shock” – MIT News
- The Fiscal and Economic Effects of the Revised April 9 Tariffs – The Budget Lab at Yale
- Port of Long Beach Busiest in U.S. through First Quarter – Port of Long Beach
- Port of Long Beach named busiest US port in Q1 2025 – Port Technology International
- The ‘China Shock’ Offers a Lesson. It Isn’t the One Trump Has Learned. – The New York Times
- Port of Long Beach Powers 20% of Local Jobs – Port of Long Beach
  |
Article by Ishita Gupta ’27 and Leonora Willett ’25 Data Journalists |