Your Neighborhood’s Impact on Income
How Accessible is the Ladder in Your Neighborhood?
In March of 2018, economists from Stanford and Harvard teamed-up with the U.S. Census Bureau to produce a longitudinal study investigating the relationship between race and economic opportunity in the United States. By tying de-identified IRS tax returns to Census Bureau data, the researchers were able to produce an intergenerational study spanning 1978 to 2015. Some of the most striking, if unsurprising, results confirmed that there are large disparities in upwards income mobility — the ability to climb the rungs of the economic ladder — between different ethnic and racial groups within the United States.
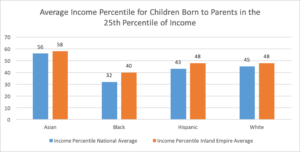
The findings indicate that Asian children have the highest level of upwards income mobility in the United States; an Asian child with parents at the 25th percentile of income distribution in 1978 reached the 56th percentile on average as adults in 2015. White and Hispanic children born to parents in the 25th percentile have only slightly lower levels of mobility, as they on average reached the 45th and 43rd percentiles, respectively. Black children fared the worst in terms of upwards income mobility, reaching on average the 32nd percentile if born into a family in the 25th percentile. Notice that in all cases there is some regression to the mean as the children born into the lower end of the spectrum climb the ladder to a higher average place in the income distribution.
But is this the case in southern California?
Overall, growing up in one of Los Angeles, Orange, Riverside, or San Bernardino counties in the 1980’s boded well for children of lower income families, as all racial and ethnic groups in these counties had higher levels of income mobility than the national average. Asian children of families in the 25th income percentile fared two percentiles better than the national average and white children three percentiles better. Hispanic children with parents in the 25th percentile actually closed the inter-generational income gap with their white counterparts, as both groups on average achieved the 48th percentile. The largest disparity between the national average and the Inland Empire outcomes was seen in Black children, who on average placed 8 percentiles higher than the national average.
As the researchers note, the causal mechanisms behind inter-generational income gaps between ethnicities are not yet fully understood. However, neighborhood-level factors (school district and housing quality, level of racial bias, etc.) have been recognized as a crucial part of the income mobility calculus. In short, where you grow up matters. In collaboration with the Census Bureau, researchers at The Opportunity Atlas project have mapped, on a tract-by-tract level, which neighborhoods offered children the best chance to rise out of poverty.
While on an aggregate level the southern California provides poor children of all races and ethnicities better than average opportunities to earn more than their parents, there remain huge disparities on a neighborhood by neighborhood level. In fact, growing up on one side of the street or another can drastically change the outlook for future earning potential. For example, children of all ethnicities who grew up in families at the 25th percentile of national income in downtown La Habra finish in a lower percentile of income than the California average, and only Hispanic children finish in a higher percentile than the national average. But just to the north, in La Habra Heights, the story is completely different. Children born into families at the 25th percentile of national income in La Habra Heights finish on average in the 51st percentile of income as adults, well above the southern California and national averages. Though these children were born into families in the same national income percentile, they tended to finish in very different places.
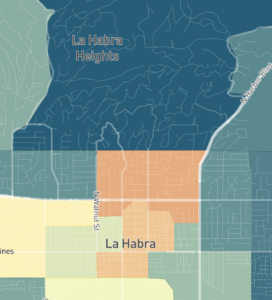
Snippets from the Opportunity Atlas demonstrate neighborhood outcome disparities such as the one between La Habra and La Habra Heights. The dark blue shading In La Habra Heights corresponds to higher-than-median levels of income as an adult (the average individual income of children from the 25th percentile of national income as an adult was 36k) whereas the darker orange shading in La Habra corresponds to lower-than-median levels of income as an adult (the average individual income of children from the 25th percentile of national income as an adult was 22k).
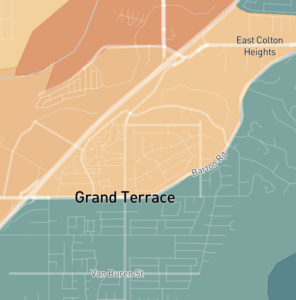
Similarly sharp local disparities can be found across the southern California, from Anaheim to Indio. In Grand Terrace, the neighborhoods on either side of Barton Road display markedly different prospects for future earnings. On average, poor children (parents’ income in the 25th percentile nationally) who grew up in the tract south and east of Barton Road earn 5k more as adults than those who grew up in the tract to the west. Disparities are even more stark in the case of Hispanic and Black children, as those who grew up east of Barton road earn 9k more and 17k more than those to the west respectively.
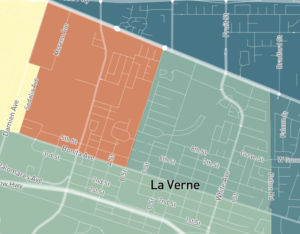
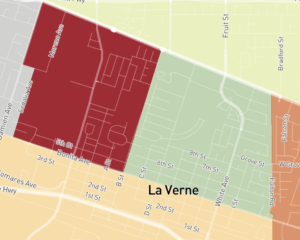
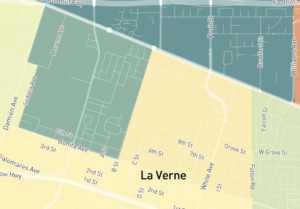
While in many cases the variations between neighborhoods affect the income mobility of all ethnicities in a similar manner, there are also some cases in which neighborhoods have opposite effects on income mobility depending on the race or ethnicity of the child. The two neighborhoods in La Verne sandwiched between Foothill Blvd and Bonita Ave and divided by B Street provide a perfect example of this phenomenon. While poor White and Asian children fared much better growing up to the east of B Street (earning 7k and 17k more as adults than those who grew up to the west of B Street, respectively), poor Hispanic children fared better growing up in the neighborhood west of B Street (making 4k more as adults than those who grew up to the east of B Street).
It is unclear exactly why outcomes vary so drastically depending on ethnicity in certain neighboring tracts, but the authors of the original longitudinal study offer a few possible explanations, such as levels of racial bias within a community and housing segregation. Unsurprisingly, greater racial bias and higher levels of housing segregation are correlated with worse outcomes for non-white children. However, it would be difficult to discern if either of those factors were present in the late ‘70s and early ‘80s.
The case of the southern California appears to affirm the findings of the economists and Census Bureau officials that one’s childhood neighborhood as well as one’s race or ethnicity have a potentially large impact on ability to escape poverty. We should exercise caution in trying to attribute disparities in adulthood outcomes entirely to either one of these variables alone, as the intersection of the two produces complex and varying results. The results also suggest a more nuanced conception of America’s traditional moniker as “the land of opportunity” is necessary. While we would like to believe that anyone from any corner of the United States is capable of climbing to a better life, certain corners have better ladders than others.