Intergenerational Mobility Analysis of the Forbes 400 List

Article by Kara Hagler
The “Great Gatsby Curve”, coined by former chair of the Council of Economic Advisors, Alan Krueger, shows that countries with higher income inequality also typically have lower intergenerational income mobility. In this article, I study mobility at the very top of the wealth distribution in the US using the Forbes 400. The Forbes 400 is a detailed list of the wealthiest Americans and their approximated net worth. Collecting data on the top 100 individuals on this list each year from 1983 to 2020, I examine how often individuals on this list change, the role that family dynasties play, and time dynamics in the concentration of wealth.
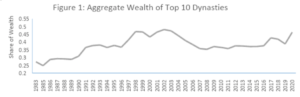
For each year, I arrange the Forbes 400 list by dynasty to explore each group’s total wealth. A dynasty is defined when an individual enters the list. Any related individual that subsequently enters the list is then grouped into the same dynasty. By this definition, a dynasty can be a single individual if no family members enter the list. The largest dynasties on the list include the Mars family (M&M), the Walton family (Walmart), and the Koch family. Figure 1 displays the share of wealth in the top 100 that is held by the top 10 dynasties each year. The figure shows an upward trend in the share of dynasty wealth, meaning that wealth is concentrating among the top individuals and their families. In 2020, the top 10 dynasties held nearly 50% of the wealth of the top 100.
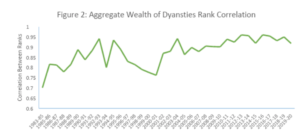
To explore mobility, I computed the rank correlation of dynasties, measuring these dynasties by aggregate wealth (i.e., the sum of wealth held by all individuals within that dynasty). The rank correlation is the degree by which ranks are related between year t-1 and year t. Ranks are defined as the position on the Forbes 400 list, starting with the wealthiest at the top and descending down. Figure 2 displays the rank correlation over time and demonstrates an upward trend. Thus, dynasties are staying at approximately the same ranks, with correlation reaching a maximum of about 0.96. This finding shows that mobility on the list is decreasing over time as fewer dynasties change their rank on the list.
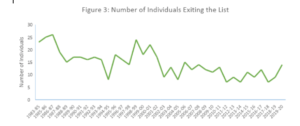
I also computed the number of dynasties exiting the list each year by comparing a list in year t with the list in year t-1 and counting which dynasties no longer appear. Figure 3 plots this number over time, which displays a downward trend. Some recent years have as few as 7 exits from the list. This result suggests that there is less mobility on the Forbes list and fewer new entrants. These same results hold if you compare the lists at time t and t-5, which allows for potential fluctuations where a dynasty is off the list in one year but re-enters in subsequent years. In general, dynasties on the Forbes 400 list are becoming increasingly sticky.
Taking these results together, I show that, since the 1980s, wealth is concentrating among the top dynasties in the US. Further, mobility on the Forbes list is decreasing, as fewer dynasties move around on the list and fewer dynasties leave the list year to year. Much academic research has found that average mobility in the US is falling. This article contributes to this literature by showing that, even at the very top of the wealth distribution in the US, mobility is falling quite dramatically as wealth concentrates among family dynasties. We may not be far from seeing zero individuals exit the Forbes list year after year.