Irrational Voting: A Case of Fuel Taxes and Transportation Investment
Despite split opinions on the Road Repair and Accountability Act, analysis from the Lowe Down shows that in the long run the fuel tax will help rather than hurt wallets in the Inland Empire.
In November of 2018, California Proposition 6 was defeated in a statewide vote, ensuring the survival of the Road Repair and Accountability Act (SB 1). The majority of Inland Empire residents were presumably unhappy with the result, with 56.5% of voters in San Bernardino and Riverside Counties voting to repeal SB 1, but the bill will certainly benefit the Inland Empire in the coming years.
SB 1 is designed to provide an additional $54B in transportation investment in the next decade by placing a 12¢/gallon tax on gasoline and increasing vehicle registration fees by approximately $50 throughout the state. With Inland Empire residents facing some of the most arduous commutes in California, perhaps it is unsurprising that they voted against a fuel tax. In fact, previous analysis from the Lowe Institute estimated that a 12¢/gallon increase in gas prices could cut into the disposable income of Inland Empire drivers by almost $70 per year. Similarly, research from the Institute of Spatial Economic Analysis shows that Inland Empire residents spend more of their income on gas for commuting than residents of any other California region. Many large Inland Empire communities, such as Fontana, Moreno Valley, Corona, Rialto, Perris, Coachella, Lake Elsinore, and Adelanto even spend upwards of 8% of their income on gas for commuting.
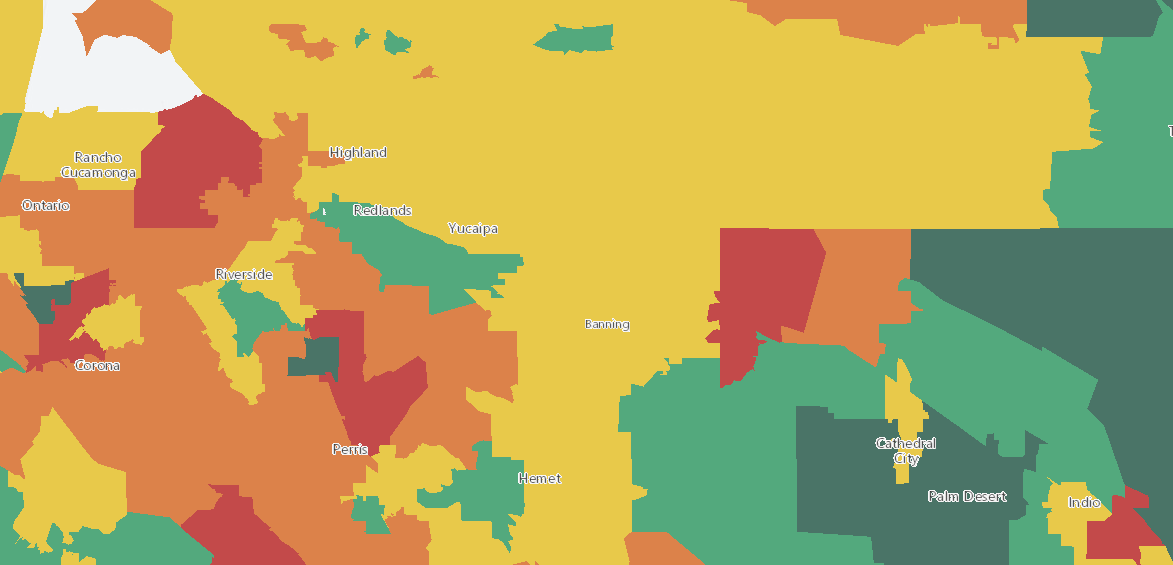
Key: Red > 8% income spent on gas for commuting, Orange 6%-8%, Yellow 4%-6%, Green < 4% (credit to Iseapublish.com)
Despite the fact that SB 1 would further increase commuting costs and disproportionately affects commuting-heavy regions such as the Inland Empire, the benefits of increased transportation investment far outweigh these costs. In its yearly analysis of California’s infrastructure, Infrastructure Report Card gave California an overall grade of C-, with the roads category receiving a D. Roads in the Inland Empire are in worse condition than the state average, with 78% of major roads being categorized as in poor or mediocre condition. Furthermore, poor road conditions cost Inland Empire drivers an estimated $2,675 a year in vehicle operating costs (VOC), safety costs, and congestion costs. Only drivers in Los Angeles and the Bay Area face higher total costs due to road conditions.
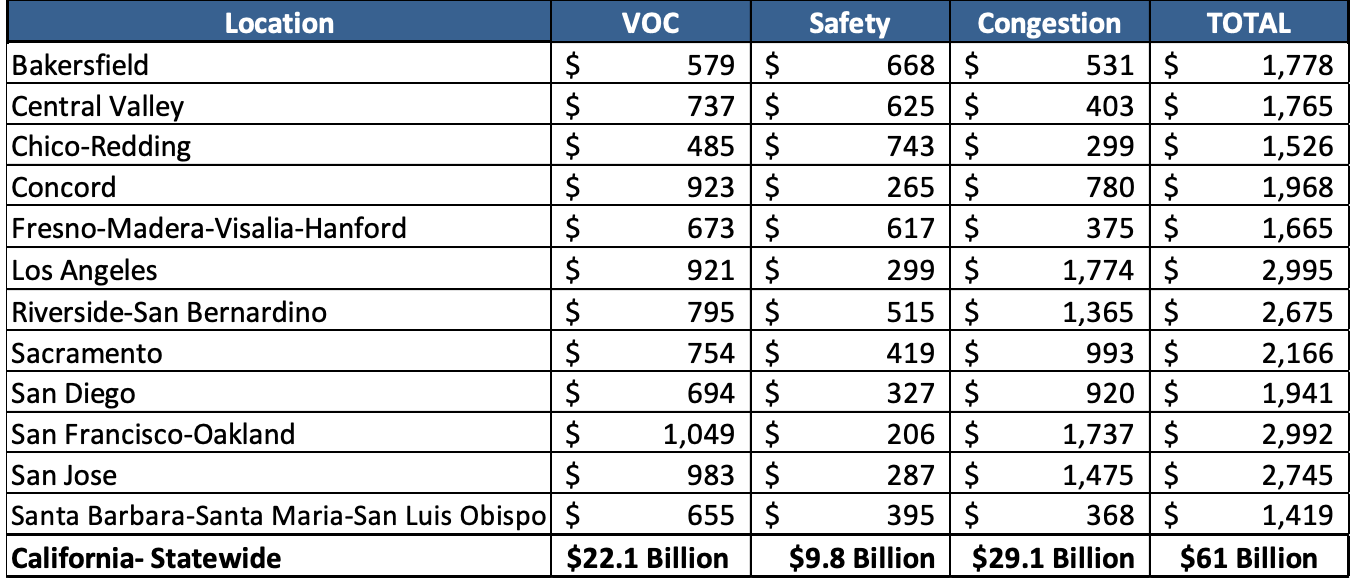
(driver costs per year broken down by California region, credit to tripnet.org)
However, SB 1 funds could go a long way towards reducing costs to drivers in the Inland Empire and across the state. The Federal Highway Administration estimates that each $1 spent on road, bridge, and highway repair can save drivers $5.20 in maintenance, safety, and congestion-related costs. If, as current project data indicates, the Inland Empire receives a near-proportional share of SB 1 funds, the region can expect to receive approximately $5B in state and local project funding. This level of investment would translate to an estimated $945 in driver savings per year on maintenance and repair costs, safety costs, and congestion costs.
Even if we consider a more meager level of investment, one in which the Inland Empire’s transportation network receives well below a proportional amount of SB 1 funds, there are additional economic gains that should be considered. For example, The White House Council of Economic Advisors finds that for every $1B invested in infrastructure, 13,000 jobs are supported each year. There could also potentially be large efficiency gains for logistics companies in the Inland Empire due to improved quality of the transportation network.
In short, the additional $70-$120 in fuel taxes and vehicle registration fees borne by residents of the Inland Empire each year is eclipsed by the hundreds of dollars they will be saving by driving on improved roads.
Voters in the Inland Empire weren’t alone in voting against their best interests, as 31 counties voted “yes” to repeal SB 1. Political ideology might be one explanation, with the voting bifurcated along traditional lines: coastal, liberal counties tended to support SB 1 whereas inland, more conservative counties voted against SB 1.
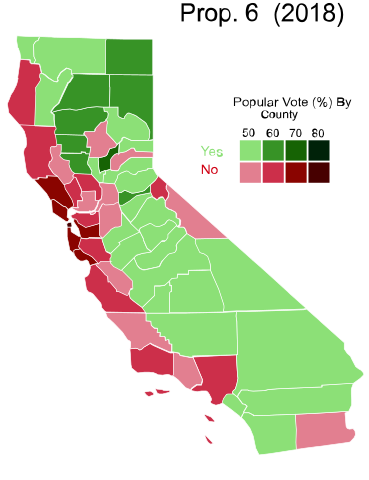
(wikipedia)
Interestingly though, among the 31 counties in favor of repealing SB 1 were many of the counties whose residents see a relatively large proportion of their income spent on gas for commuting, such as Yuba County or the counties of the Central Valley. It appears that for these counties in particular, the spectre of an immediate and highly visible hit to your wallet in the form of increased fuel costs was more powerful than the prospect of considerable savings on driving costs in the future. If anything, SB 1 demonstrates the importance of framing the bill as an investment opportunity with a proven high rate of return and not simply a fuel tax.