The Impact of Industry Donations on Voting in Presidential Elections
Article by Anya Syed
Reporting on elections frequently conveys which industries are giving money to which candidates. But these donations are often dominated by the executives of corporations. Do the votes by people employed in that industry align with the candidates to whom the money from that industry flows?
To investigate, we analyzed whether counties with high employment in a sector tend to vote for the candidate that received the most donations from that sector. We compared the 2008 and 2012 Presidential elections. In each case, President Obama was running against a non-incumbent Republican: McCain in 2008 and Romney in 2012. However, the ratio of donations differed greatly between 2008 and 2012, as Obama’s overall donations decreased in 2012.The graph below depicts that Obama was receiving more overall industry donations while running against McCain compared to when he was running against Romney.
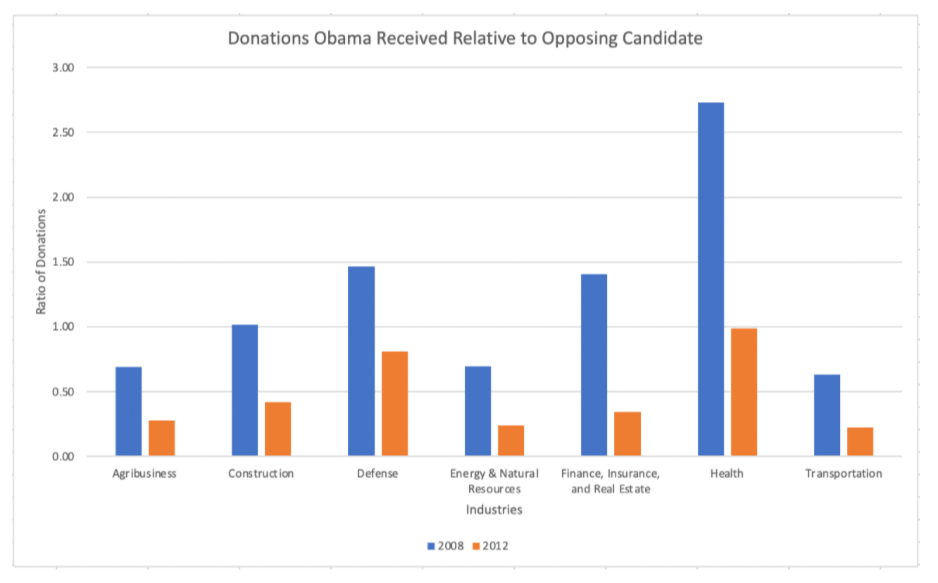
We analyzed seven main sectors: health, construction, energy, finance, agribusiness, transport, and defense. For each county, we compared the change in Obama’s vote share to the change in the donations from that county’s set of industries. For instance, Romney received far more donations from finance than did McCain. Did Romney also receive more votes from those counties, such as Dallas County, Iowa, with high employment in finance? However this did not seem to have a bearing on voting, as we found no significant relationship between the donations from industries and the votes from counties where people are employed in those industries.
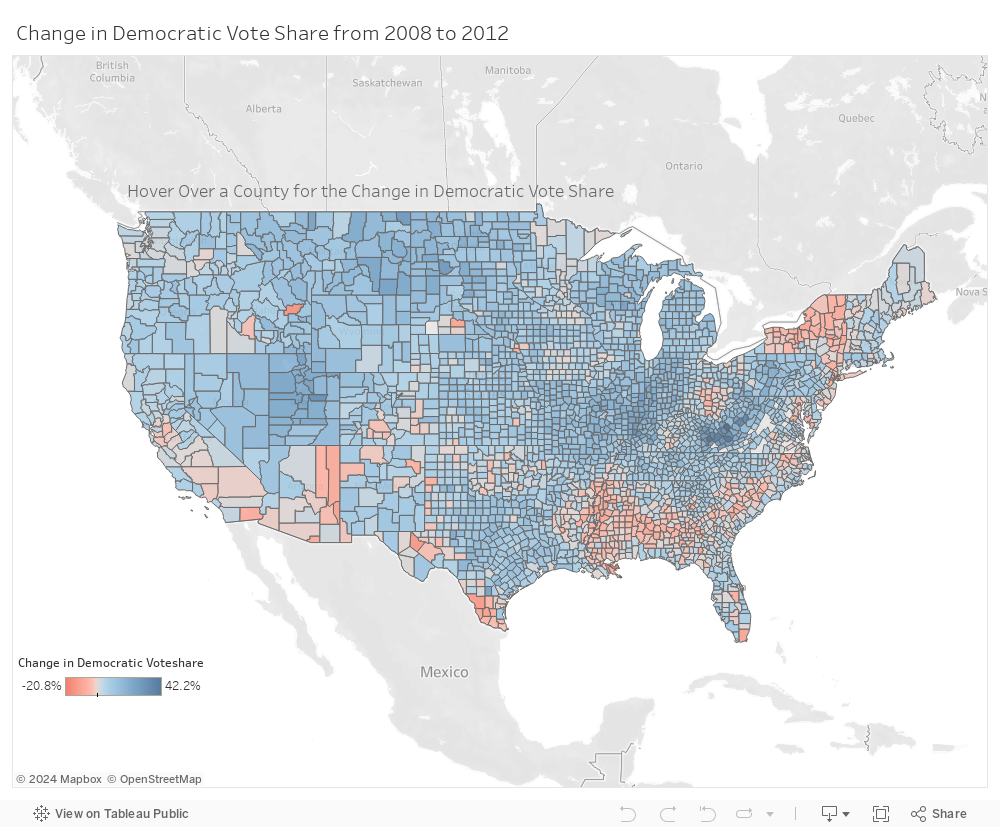
The above map demonstrates the difference between Obama’s vote share between 2008 and 2012. The red counties indicate more Republican voters in 2012 compared to 2008, while the blue counties indicate more Democratic voters.The darker shade of blue indicates a more dramatic shift in the vote share towards the Democratic party. There are no viable trends that can be gleaned from the map.
There could be several reasons for this. Money donated by major corporations in industries may not reflect the concerns of workers employed in that sector. Although industry-relevant regulations may be a factor for some voters, others may be more inclined to vote based on social and cultural affinity. Or they may feel that their pocketbook is more strongly affected by issues beyond those which motivate their industry, such as characteristics of candidates and general government performance. It is evident from our analysis that workers are not necessarily going to vote for whom their industry leaders have decided to support. So when we read, “Industry X is supporting candidate Y,” we should be careful to remember that this does not necessarily correspond to how those workers vote.
Mapping contributed by Leo Kitchell