How has Covid-19 impacted the allocation of air-traffic in cities with multiple airports?
Article by Angelina Astillero.
It is hard to overstate how devastating 2020 has been for the airline industry. Back in April the demand for air travel was down 99 percent from the previous year, and it is not expected to recover to pre-pandemic levels for years. In response to the pandemic, most airlines went into crisis mode, cutting almost half of their normal schedules, grounding out-of-use planes, and furloughing tens of thousands of workers. This year’s revenue losses are expected to top $22 billion. But has this pain been spread equally?
In the Great Recession of 2008-9, primary hubs kept a higher percentage of their passengers than the secondary airports in the same metropolitan areas. But a recent analysis by the Lowe Institute suggests that smaller airports in multi-airport regions have received the same, if not a larger, percentage of air travel during the pandemic months in the cities they serve. We use data from the five airports that serve Los Angeles, the four airports that serve New York City, the four for San Francisco Bay Area, the three airports that serve Boston, and the two for Chicago. In each city, there is a dominant “queen” airport that serves the majority of air travel in the region and one or more secondary airports.
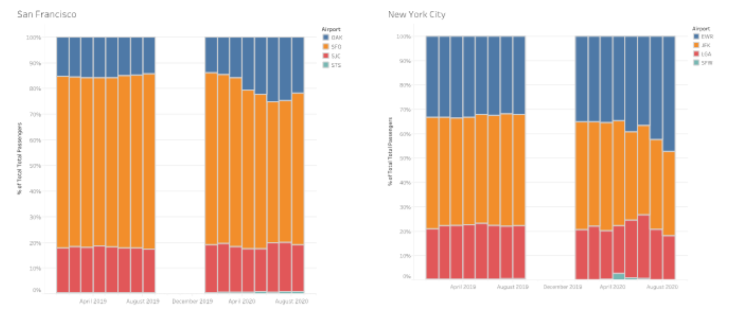
Contrary to the experience of 2008-9, in cities such as San Francisco, Boston, and New York, the percentage of air travel in secondary airports has actually increased during 2020. For instance, the Oakland International Airport (OAK), which typically accounts for about 15% of total air travel in the Bay Area, has accounted for nearly 25% of air travel since June. Between August 2019 and August 2020, Newark’s Liberty International Airport (EWR) went from the secondary airport serving New York City to the dominant airport for the region. Throughout 2019, EWR accounted for about 32% of total air travel. In July 2020 the airport managed 42% of air travel and further widened the gap in August to 47%.
Boston’s dominant airport, Boston Logan International Airport (BOS) which pre-pandemic accounted for nearly 88% of total travel, has seen a severe decrease in total percent. In March 2020, BOS only managed 69% of passengers while Manchester-Boston Regional Airport (MHT) managed about 25%, a 21% increase in percentage total. While March was a temporary outlier, by August, the market share of secondary airports remained nearly double the pre-pandemic average.
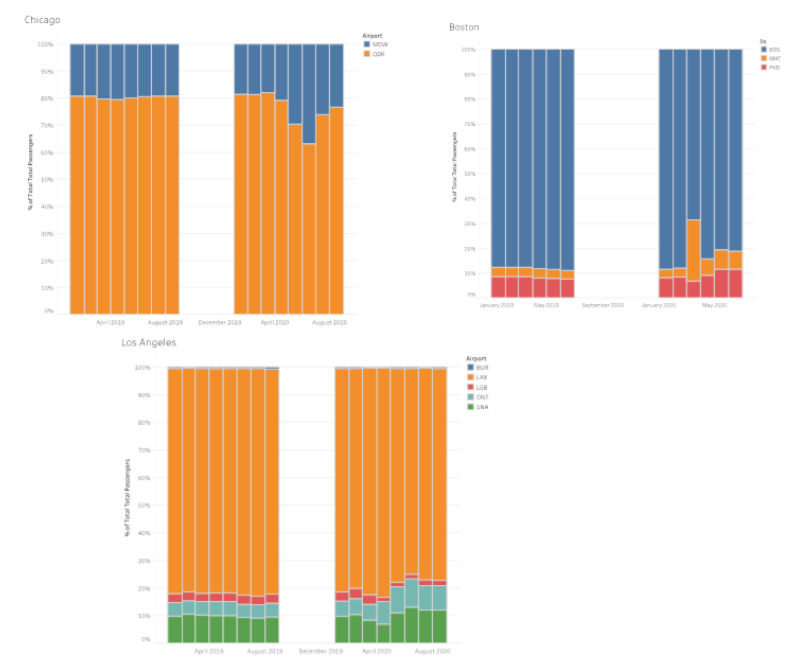
Through August 2020, airport market shares in Los Angeles were less dramatically changed. The dominant queen, LAX, had declined only modestly from 82% to 78%.
Much of these changes can be explained by differences between the local infections rates within the same metropolitan area. For instance, when COVID-19 rates spiked in Cook County (the location of Chicago’s queen airport, ORD) ORD’s market share fell below 80%. Correspondingly, as DuPage county, the site of Midway airport, reported significantly lower rates of Covid-19, Chicago Midway (MDW) received 30% of passengers in May and nearly 37% in the following month. As the spike in Cook county Covid cases receded in July and August, ORD’s market share recovered. Alameda County (where OAK is located) has consistently reported fewer cases than San Francisco county (where SFO is located). Throughout the pandemic, Essex county, home to Newark airport, has reported considerably lower COVID-19 rates than the five counties of New York City.
However, the increase in percentage of total travel through Newark might also have something to do with New Jersey’s less restrictive COVID-19 guidelines. In New Jersey travelers are encouraged to complete a voluntary health survey, however New York requires fliers to complete a traveler health form or risk a $10,000 fine. The higher rates of COVID-19 and strict guidelines have likely impacted people’s decisions to travel through EWR rather than JFK.
The decline in air travel during the Great Recession was driven by a decline in demand due to loss of income. As such, it hit peripheral areas—whose residents are more likely to hold the marginal jobs cut in a recession—harder than central cores where businesses and jobs are less susceptible. But the Covid-driven decline in air travel is different, driven by a mixture of caution and regulation. As a result, shifting market shares are driven by the geography of the virus. In this, the airline industry is like many other businesses: containing the virus locally is the prerequisite to keeping customers and jobs.