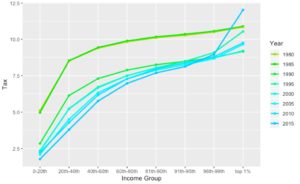
California Average State Tax Rates on Personal Income from 1980 to 2015
The Lowe Institute calculated the average personal income state tax rates for various income brackets from 1980 to 2015. We find that, in this most visible category of taxation, California has increasingly leaned on the 1% in the twenty-first century.
In October, economists Gabriel Zucman and Emmanuel Saez of University of California, Berkeley published their book called “Triumph of Injustice.” Although controversial in some of its calculations, such as the amount that a wealth tax can generate, an important takeaway from the book and their research is that over the last century the tax system has become less progressive. They arrived at this finding by creating a database of how much combined local, state, and federal tax people in different income groups have been paying. Their calculations cover all forms of tax including income, capital gains, sales, FICA, and so on. Their access to novel data sets allowed them to go beyond the top 1% and track the tax paid by the top 400 wealthiest households. Surprisingly, they showed that in recent years the tax rate on the top 400 households is lower than all of the other income groups, casting doubt on whether the tax system as a whole is truly progressive.
Much of the conversation around taxation centers on income taxes. They are the most visible component of the tax system; revisited in a reviled annual ceremony every April as households decipher the Byzantine tax code in fear of having to pay additional taxes. As the most visible component, income taxes mostly clearly reflect society’s views on the proper progressivity of taxation. Using the marginal California state tax rates and brackets, we calculated the average state income tax rate on different income groups from 1980 to 2015. Without access to California income brackets data, we used the national income brackets data to calculate the average tax rates on various percentiles of income.
Our calculations show two distinct shifts. First, we can see the broad-based reduction in tax rates that occurred in the late 1980s. Average rates in the top 1% declined from over 11% to under 9% and average rates in the bottom quintile declined from 5% to just over half that much. Second, we can see the continued gradual shift toward progressivity in 90s and 00s. Finally, we can see the large increase in the average rate paid by the top 1% as a result of Proposition 30 of November 2012 which instituted a four new top tax brackets for taxable incomes exceeding $250,000. As of 2015, earners in the top 1% faced an average 12.03% personal income tax rate, whereas earners in the lowest quintile faced 1.78%.1 While tax policy may not be holistically progressive at the federal level, driven by an increasing awareness of the runaway success of the top few percentiles, our strongly progressive state has acted to push against perceived market inequities by changing the most visible component of the tax code.
Article by Mert Akan.