A Study of Low-Income Communities and School-to-Prison Pipelines

Article by Julia Garbee
A Study of Low-Income Communities and School-to-Prison Pipelines
“School-to-prison pipeline” is a term coined by civil-rights advocates for the close relationship between school discipline and the criminal justice system. Attending a school with a high suspension rate could mean a 15% to 20% higher likelihood of a child being incarcerated as an adult, a 2019 NBER paper finds. While the integration of police presence in schools is indisputable, our goal in this analysis is to determine the statistical relationship between suspension rates and juvenile incarceration rates.
We find that California juvenile imprisonment rates and suspension rates are largely driven by socioeconomic status. Initially, when looking at the log of juvenile imprisonment rates and suspension rates, we found that juvenile imprisonment rates were correlated with suspension rates. However, once we controlled for other variables, such as home value and fixed county and year effects, the strong correlation diminished. This reveals that socioeconomic status, captured both by county fixed effects and home values, is a stronger predictor of juvenile imprisonment rates than simply suspension rates on their own. Suspension rates, though, are also predicted by socioeconomic status variables, highlighting that imprisonment rates and suspension rates occur together but aren’t necessarily a product of one another.
Students from low income districts have a significantly higher risk of suspension. Low income students are 9 percentage points more likely to be suspended in a given year than their non-low-income peers, the Education Research Alliance finds. Low income students also receive longer suspensions, at a modest 0.10 more days, than non-low-income students for the same infraction.
The school-to-prison pipeline in the U.S. thrives in low-income neighborhoods for two main reasons: environmental instigators and a police-focused response. We find that living in a low-income community is a high predictor of crime. Children raised in these communities don’t have a chance from the start. Parents often don’t earn enough to support an entire family or are in prison themselves. As a result, families become fragmented, leaving few adequate caregivers to coax them out of this cycle. Schools in these communities only perpetuate this problem. School suspension often turns into expulsion, which then turns into continuation schools and finally to juvenile detention. These conditions, coupled with over-policing, create the school-to-prison pipeline. “It is not just the existence of oppressive police apparatuses … they are also the only mechanism that is being used to address issues” in low socioeconomic communities, remarks Professor Nigel Boyle, Professor of Political Studies at Pitzer college who teaches inside-out courses and whose research focuses on the political determinants of social inequality.
It is not surprising that Black students have a much higher likelihood of being suspended than white students, as socioeconomic status, proxied by home value, is highly correlated with race. 18% of black boys and 10% of black girls received an out-of-school suspension in 2013-14, compared to only 5% of white boys and 2% of white girls, the U.S. Department of Education reports. This disparity appears before students even reach high-school. 48% of preschool children suspended more than once are black. These differences are not explained by poor behavior. Several studies have examined the relationship between race, behavior, and suspension, but none have found that black students misbehave at higher rates.
Exclusionary discipline, like suspension and expulsion, lead to lower academic achievement, probability of on-time high school graduation, and greater contact with the juvenile justice system. Socioeconomic status is one of the most well-documented correlates with juvenile delinquency. Black students, representing only 16% of student enrollment, make up 27% of students referred to law enforcement and 31% of students subjected to school-related arrests.
In our analysis, we used total suspension rates by county from the California Department of Education for academic years 2011-12 through 2015-16. Suspension rates reflect the unduplicated count of students suspended divided by the cumulative enrollment of the county’s student population. Juvenile imprisonments per 100,000 youths ages 10 – 17 were retrieved from the Center for Juvenile and Criminal Justice’s California Sentencing Institute. The suspension rate data and juvenile imprisonment data were merged by county and year, adjusting the imprisonment year so that it aligned with suspension rates academic year (2012 became 2011-12). Next, data from Zillow was added to approximate the socioeconomic status in each county, summing monthly data into yearly data. We used panel data analysis to run a regression of log imprisonments per 100,000 youths on the suspension rate , controlling for log home values and academic year and county fixed effects.
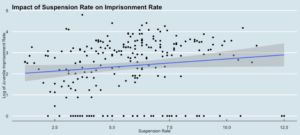
Suspension rates are positively correlated with juvenile imprisonment rates
Our regression analysis shows that Juvenile imprisonment rates increase by 11% when the suspension rate increases by one. The positive relationship is highlighted by the figure below.
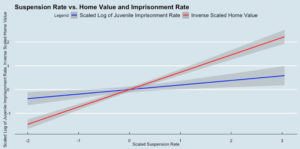
Suspension rate captures socioeconomic status
Delving deeper into the mechanics, we find that our positive correlation becomes statistically insignificant once we control for Socioeconomic status via log home values. This effect occurs because both juvenile imprisonment rate and home value are correlated with suspension rate. In our previous analysis, isolated to only suspension and imprisonment rates, suspension rate acts as a proxy for socio-economic forces.
Socioeconomic variation by county drives suspension and imprisonment rates
Further, adding fixed county effects also leads to the suspension rate not being statistically significant. We interpret this result as evidence that most of the variation between suspension rate and imprisonment is driven by across county variation in socio-economic status.