By Arnav Swamy
On March 23, 2021, the Ever Given – a 400 meter container ship carrying around $1 billion worth of commodities – ran aground in the Suez Canal, blocking one of the world’s most crucial shipping arteries for six days, halting around 12% of global trade. Across the world, from Tokyo to Rotterdam, supply chain vulnerability became the new passion and focus for business leaders and investors alike. I investigate which factors positioned some companies to endure the shock while others faltered.
Conventional wisdom would suggest that companies that had an ample supply of inventory would fare better than those without. If the majority of a company’s suppliers are impeded by a blockage of uncertain duration, having ninety days of inventory seems more enabling of continued operations than thirty days of inventory. If inventory was truly a buffer, its effect would be strongest for companies whose supply chains were most vulnerable to the shock – namely European companies who establish their trade routes with Asia through the Suez. This intuition drove my core research question: did pre-existing inventory levels serve as a buffer on the stock price for companies during the Suez Canal crisis, and did this effect differ between European and American companies?
To investigate this, I constructed a comprehensive data set for 637 companies with market caps above $500 million across the United States and Western Europe in core industries vulnerable to the shock, including industrials, consumer discretionary and staple items, and materials using Bloomberg. As my proxy for each company’s pre-shock buffer, I calculated days of inventory outstanding (DIO), a capital management ratio that indicates how long a company holds inventory before selling it. This number captures how many days a company can rely purely on its existing inventory if its supply is stopped due to the blockage. To best capture the market impact of the shock, I calculated each company’s cumulative abnormal returns (CAR), which is the amount of each stock’s movement that cannot be explained by broader market movement. I divided the event into three portions: the period before and immediately when the shock occurred (March 22-24), the middle of the shock (March 25-26), and the window after the canal was cleared (March 29-31). This was crucial in determining exactly at what point inventory mattered across the lifetime of the shock. Lastly, to ensure that I solely captured the effect of the shock, I controlled for various factors like leverage, business risk, gross margins, and sector.
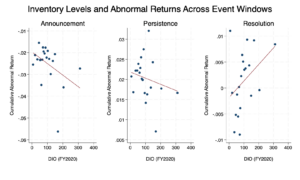
Figure 1 represents the findings from this analysis, binning the 617 companies with a DIO less than 400 days into 20 bins, each represented by a dot on the scatter plots. Ultimately, DIO was statistically insignificant at the 5% level across all three windows of the shock. None of the lines of best fit seem to accurately map a consistent direction across the three windows. On announcement and persistence, there was a clear negative correlation, suggesting that companies with high inventory cushions actually fared worse during the shock. Only during the resolution window did the relationship turn positive, suggesting that inventory may have a modest benefit after the immediate disruption of the shock. Across all three windows, however, the effects were too small to conclude that markets systematically rewarded firms with more robust inventory cushions. This null result was fascinating, however, as it shifted my focus to determine exactly where this shock was most obvious and interpretable.
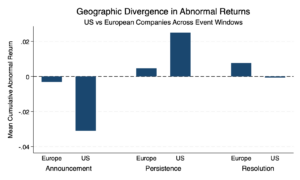
When I included a variable distinguishing European companies from American companies, the explanatory power of my model nearly doubled, signifying the importance of geography in relation to the shock. We can examine these results in Figure 2. On announcement day, European stocks fell significantly less than their US counterparts — dropping only 0.3% compared to 3.1% for US firms. During the persistence window, as the blockage dragged on longer than investors initially anticipated, both regions recovered, but US stocks bounced back far more strongly — gaining 2.5% compared to only 0.5% for European firms. After the canal reopened, European stocks edged positive at 0.8% while US stocks dipped slightly negative at 0.1%, suggesting that as the shock dissipated, European stocks were able to stabilize more smoothly than US stocks. Across all three windows, US stocks experienced greater volatility in both directions – falling harder, overcorrecting this fall with a strong recovery, and ultimately remaining more sensitive to the shock than European stocks.
This geographic divergence is puzzling, as conventional logic would suggest that European stocks would have been impacted more dramatically given the dependence Europe has on the canal to connect it to Asian ports compared to the US. The data seems to suggest the opposite – initially, the market punished American stocks far more than European stocks for a disruption that was more proximate to Europe.
There are a variety of potential explanations, but none resolve the puzzle fully. Perhaps there is a composition effect – though I controlled for the specific industry of each company, the American and European subsamples likely vary in themselves. An American industrials company that is extremely dependent on Asian materials will naturally be more affected by the blockage than a European industrials company that sources domestically, yet both fall under the Industrials sector dummy. Thus, if the US sample skews towards global sourcing while the European sample skews towards domestic sourcing, this divergence would reflect the sample composition rather than truly geographic pricing. More analysis in specific firm-level sourcing practices is thus required.
A second possible concern is simply a difference in the US and European equity market structures. US markets are characterized by higher algorithmic and institutionalized trading activity, which means they produce more volatile and aggressive repricing in response to shocks in the supply chain. If it is the case that US markets repriced sharply following the news, this could explain the divergence in abnormal returns, independent of any fundamental differences in economic exposure. This would also require transaction level trading data which warrants further analysis beyond the scope of this experiment.
The Suez Canal blockage created a transatlantic divergence in abnormal returns that followed a puzzling arc – US stocks bore the brunt of announcement day decline despite Europe’s greater structural dependence on the canal. Both regions recovered during the persistence stage with US stocks bouncing back more strongly. Ultimately, European stocks edged positive, compared to US stocks falling marginally negative. While I hypothesized that inventory levels played a key facet in serving as a price shield to this disruption, the markets instead seemed to have priced geographic exposure far more than firm level preparedness. This puzzle on why US stocks fell harder than European stocks despite conventional logic assuming the opposite remains open for further analysis, and resolving this presents further compelling research on how financial markets price supply chain risks in real time.
Article by Arnav Swamy
Data Journalist