Wildfires: Burning Home Value?
Article by Julia Garbee.
A shift in climate toward longer, hotter, drier summers has led to increasingly deadly wildfire seasons. Annual wildfires burn almost three times the area they did in 1985. Since 2015, the United States has experienced, on average, roughly 100 more large wildfires every year than the year before. In 2018 alone property damages suffered a total loss of more than $12.35 billion, constituting 96% of total property damages in California, an increase from 34% in 2015. Are Californians noticing? Is the risk of fire damage priced into the housing market?
Theoretically, greater risk of loss, and the associated higher price of fire insurance, should raise the cost of home ownership in at-risk areas, leading to a decline in demand. All else equal, a house in an area with frequent fires should command a lower sales price than an identical house in an area with no such risk. The overall cost of home ownership would be the same once the price of fire insurance is included. But do Californians correctly internalize the fire risk when purchasing homes? Or is this hidden cost discovered only later?
Americans are moving to high fire hazard areas at a rate faster than any other area. According to the U.S. Forest Service, between 1990 and 2010 homes in high risk areas grew from 30.8 million to 43.4 million, an increase of 41% percent. More properties mean more fuel for fires. The Hanley Fire in 1964 destroyed the same 70,000 acres as the Tubs Fire in 2017. The Tubs Fire, however, burned over 5,000 homes due to rapid development in the area.
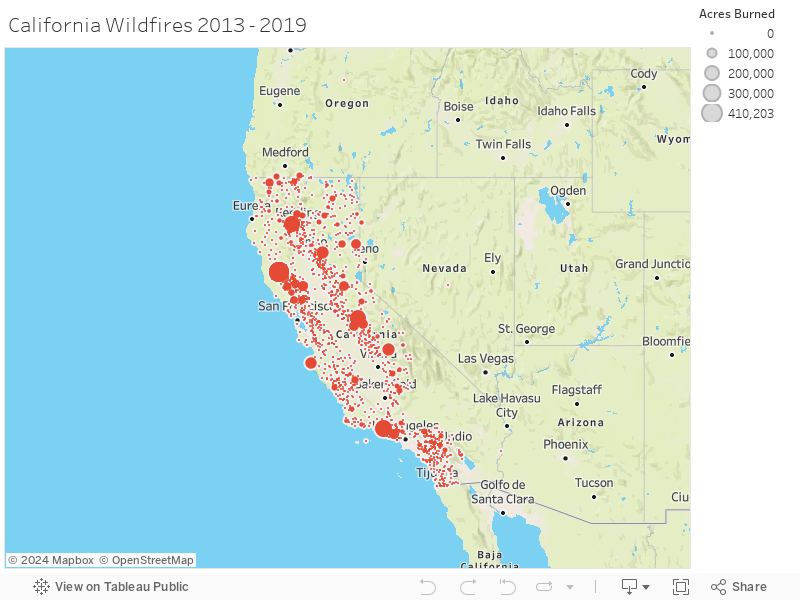
Map 1 displays the number of acres in each zip code burned by wildfires in California between 2013 and 2019. The larger the red dot, the more acres burned by a wildfire.
Map 2 reflects the growth in average housing value in each zip code in California between 2013 and 2019 on a scale from red (slower growth) to green (faster growth).

In August 2013, Tuolumne County’s Rim Fire burned 257,314 acres of land, threatening thousands of structures and ultimately destroying 112. By comparison, the neighboring county of Calaveras experienced far fewer and smaller fires.
In Tuolumne County, with a population of 54,478, housing prices grew on average 12.3% between 2013 and 2019. In Calaveras County, with a population of 45,905, housing prices grew on average 31% between the same years.
Comparing two counties of similar size, population, and distance to major metropolitan areas, but varying fire history suggests that housing prices in areas with historically larger burn areas grow at a slower rate than other areas. Regulatory expenses and risk make zip codes with substantive wildfires less desirable to live in, potentially triggering a depression in housing price growth.
Newly constructed homes built in high-risk areas, specifically Wildland-Urban Interface zones (WUI), must comply with state-regulated fireproofing standards. These standards require homes to be ignition-resistant and able to prevent flying embers from entering. In Coffey Park, a zip code destroyed by the 2017 Tubbs Fire, homes that are truly fire proof would cost $550 a square foot. Insurance payouts? $250 to $300 per square foot.
Insurance companies are increasing their rates to reflect the growing risk associated with living in high fire risk areas. Insurers even began dropping customers after losing $25 billion from the 2017 and 2018 fire seasons. According to the California Department of Insurance, 235,250 Californians have been dropped in 2019, a 31% increase from 2018. Those who are lucky enough to still have insurance have seen prices triple in the last few years.
But are the growing risk and mounting regulatory expenses large enough deterrents to impact housing value in fire-stricken areas? Statistical work suggests no.
To quantify the potential correlation of acres burned with home value growth, we used multiple-regression to uncover the relationship between acres burned and home price appreciation while accounting for other factors that influence housing demand such as population density. We find no significant relationship between acres burned in fire zones and home price appreciation at the zip code level in California from 2013-2019. Can we conclude that Californians are ignoring fire risk when making home-buying decisions?
Not quite. Eventually, the market price of a home should equal the cost of the land and construction. Immediately following a destructive fire, local home prices might actually increase due to a decrease in the supply of homes. But over a span of just a few years, house prices might depart from this long run equilibrium. A 2008 study found that demand for houses located near wildfires decreased immediately following each fire, and that demand decreased more after repeated wildfires. This trend is partly due to the increasing insurance costs, which has proven to be similarly consequential in communities at risk of flooding, driving down home value and making them harder to sell.
Wildfires are becoming more frequent and more destructive in California. Subsequently, living in high risk fire zones is putting more people’s lives and homes in danger. So far, 4 million acres have burned in California in 2020, leaving over 10,000 structures destroyed and 32 lives lost. Nonetheless, there has been no clear decline in demand for housing in threatened areas. With the housing market continuing to rebound from the 2008 recession and a consequential push away from expensive urban areas, this time frame saw a natural growth in housing prices and demand for housing in cheaper, more rural areas. It may take years for Californians to update zoning and behavior, but the price of living in high fire risk areas will eventually need to reflect this rapidly increasing risk.
Statistical analysis contributed by Ethan Kruteck.