A Case for Convergence in California
Are California’s poorer counties catching up to the richer ones? Analysis of California county growth from the Lowe Institute finds that the oft-debated theory of economic convergence should not be discounted.
In classical economics, the theory of economic convergence proposes that weaker economies grow at a faster rate than more developed economies, eventually catching-up or converging. At the heart of convergence theory is the idea that capital will earn a higher rate of return where it is scarce, thus capital should flow to less developed regions, raising their productivity. However, critics of convergence theory argue that developing economies cannot catch up through market forces alone and require government intervention. On the other hand, modern technology and information industries seem to thrive on proximity; the intellectual ferment of people with ideas meeting serendipitously. Thus, capital may concentrate in already well-developed regions, a process termed agglomeration.
Last December, the Bureau of Economic Analysis released county-level GDP data for the first time. The data spans from 2001-2018, providing a unique opportunity to examine growth trends at the county level. The Lowe Institute has taken this opportunity to see whether or not there is evidence for or against the theory of convergence between California counties. Are the poor counties catching up, or is the increasing urban-rural divide leaving certain counties behind?
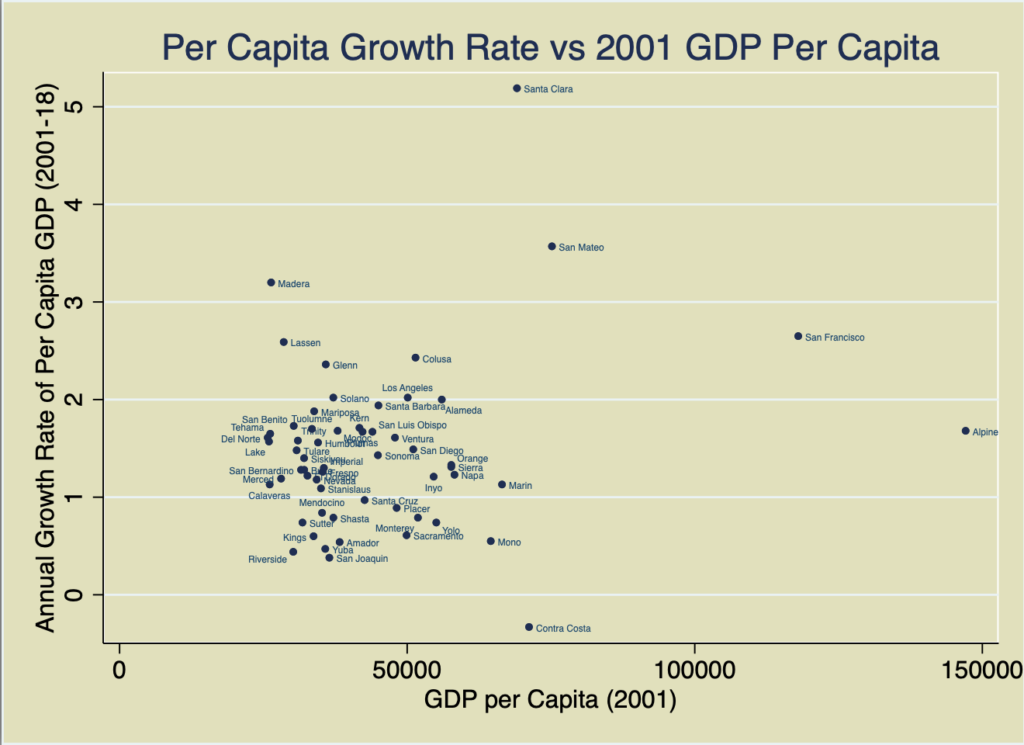
If the theory of convergence were to hold, we would see California counties that began our sample period in 2001 poorer growing at a faster rate between 2001 and 2018. As a result, we would expect a downward sloping line when we plot growth rate from 2001-2018 against per capita GDP in 2001. But the scatter plot below shows no distinct trend either supporting or contradicting the theory of convergence. While several outliers catch the eye, there appears to be almost no correlation between 2001 per capita GDP and per capita growth rate.
However, upon closer inspection, there are three groupings of counties that seem to display a tendency toward convergence. These groups, or “convergence clubs,” as they are known in the literature, are relatively distinct and seem to broadly follow an urban-rural divide. The second scatterplot below color-codes counties based on their perceived density, with urban counties in red and rural counties in green. Additionally, the three wealthy, high-growth counties from the San Francisco Peninsula are separated into their own group (colored in navy). We have added best fit lines for each of these three groups, showing that within each group, there is a distinct downward slope supporting the convergence hypothesis.
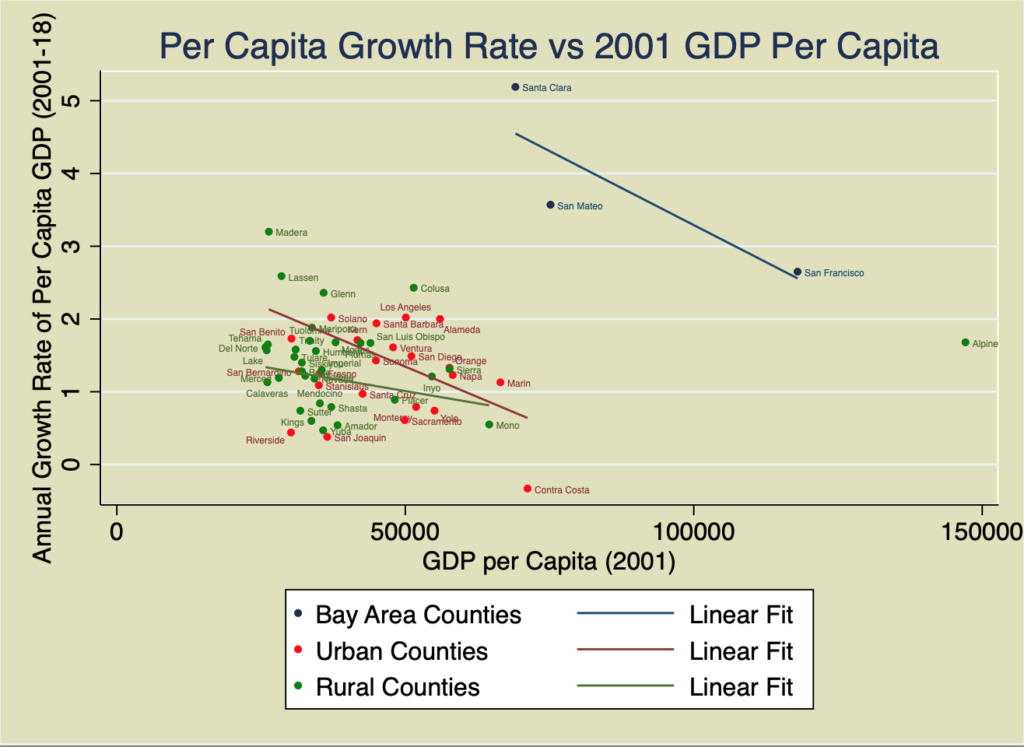
The first club is the high-earning, quickly-growing SF peninsula counties of San Mateo, Santa Clara, and San Francisco. Despite the fact that they were already rich in 2001, these counties have the highest growth rates in the state. Growth in these three counties has been buoyed by the explosion in high tech industries, which have seen double-digit annual growth rates since 2001. True to the idea of agglomeration, new tech firms co-locate with old tech firms, leading these counties to continue to grow faster than others despite their high cost. Yet within this cluster, the richer counties have grown more slowly, supporting convergence. Essentially, so long as one is close enough to other tech firms, one prefers to locate in cheaper areas.
The second group of counties is comprised of predominately urban or suburban counties. Within this group, counties such as Contra Costa that began the century relatively well off have grown less quickly than counties such as Solano that began the 21st century with more ground to make up. Again we see convergence within the group of counties who are close enough to a variety of city-based industries to make them an attractive location for investment, at which point investment tends to seek the cheapest location, bringing that location swifter growth. Nonetheless, within the group, some counties have performed better than others. The likes of Solano, Los Angeles, Alameda, Santa Barbara, Marin are the best performers while Riverside, San Joaquin and Contra Costa have tended to underperform.
Finally, the third convergence club contains mainly rural counties. As a group, these counties have performed less impressively than their more densely populated counterparts. This is consistent with the notion that the fastest growing industries tend to exhibit agglomeration economies requiring proximity, leading the rich to get richer. Nonetheless, some rural counties have seen healthy growth,such as Sierra, Glenn, Lassen, Calusa, and Madera counties. These counties have had impressive annual per capita growth rates, concentrated in a small set of extractive industries, utilities, and/or agriculture and forestry.
Several well-known studies showed that regions within countries tended to convergence in the 20th century. It has been suggested that the agglomeration effects which dominate the most dynamic industries of the 21st century have reversed this convergence. Our analysis of new county-level California data confirms the general pattern of divergence between rural and urban counties.