Women in the Workplace
Article written by Paris Masiel
Women have made up a significant portion of the labor force since before the government has collected data on the topic. Since the 1950’s, the trend of the nuclear family with the male breadwinner and stay-at-home mother has broken down rapidly, and women’s labor force participation has advanced steadily.
It is not simply the number of working women that has increased. The variety of jobs open to women has expanded greatly. However, despite the obvious gains, workplace stereotypes and general social norms have made gender-based changes within certain occupation categories more slow going.
What gains have been made over the past two economic cycles? We have used data from the Bureau of Labor Statistics’ Current Population Survey and the US Census Bureau to analyze the changing fraction of women in various occupation categories from 2003 to 2019.
At this level, there is relatively little movement over the 16 year period. There does exist a somewhat encouraging increase in female representation within management, business, and financial occupations. But we generally still see male dominance of occupations that require little education and traditionally require more physical strength.
However, these broad categories mask some more notable shifts in more specific occupations. The following dashboards expand the five broadest occupational categories, allowing you to explore.
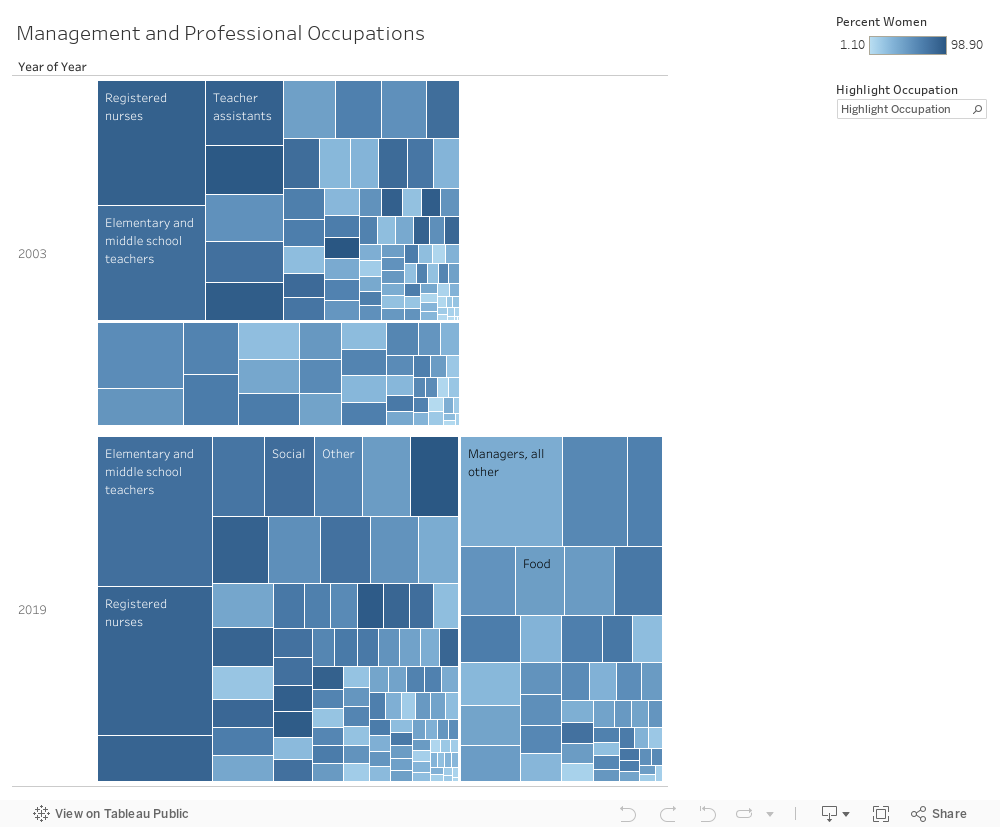
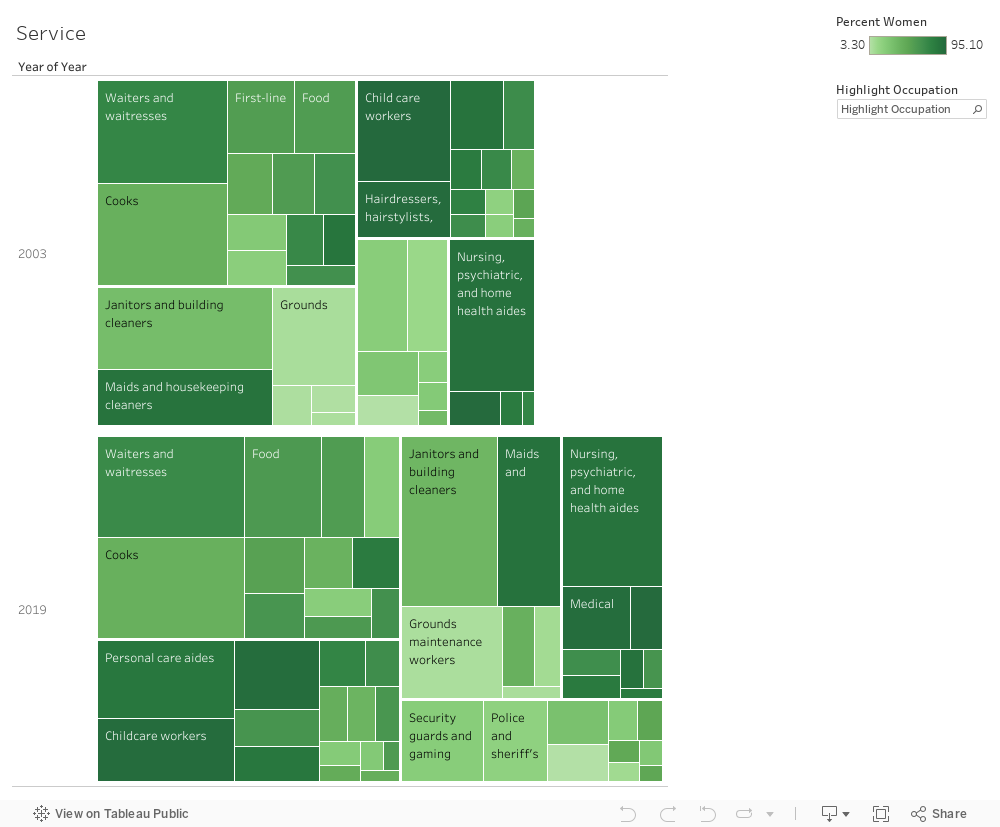

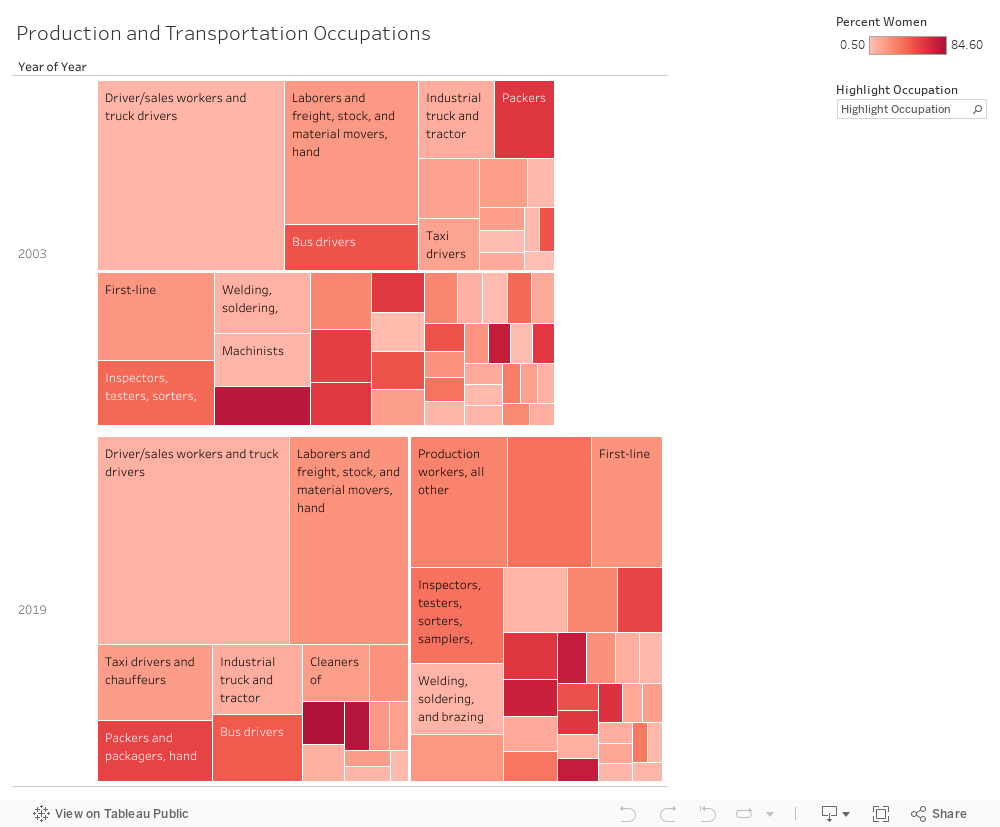
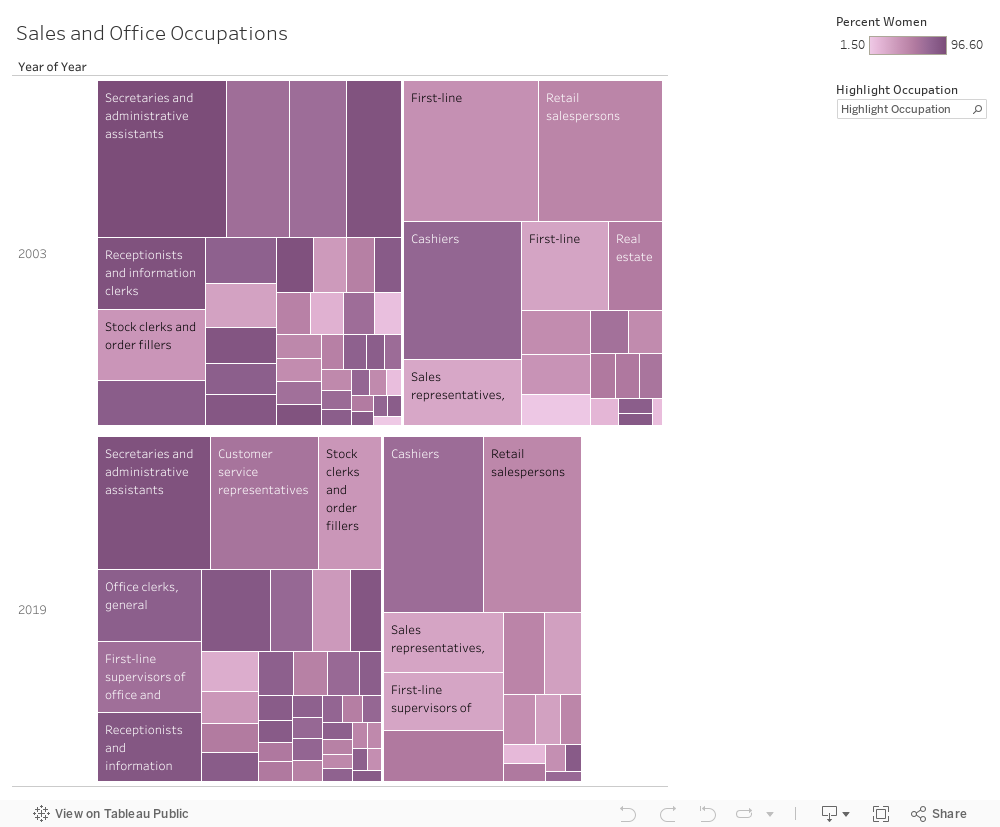
Here are some of the specific occupation changes (or lack thereof) which we found interesting:
| Occupation | 2003 Female % | 2019 Female % | Change |
| Aircraft Pilots/Flight Engineers (Prod/Transport) | 3.4 | 7.5 | 120.5%↑ |
| Counter and Rental Clerks (Sales/Office) | 58.9 | 42.6 | 27%↓ |
| Order Clerks (Sales/Office)
Food Prep./Serving Workers (Service) |
72.10
72.4 |
53.3
62.4 |
26%↓
13.81%↓ |
| Registered Nurses (Management/Professional) | 92.10 | 88.9 | 3.4%↓ |
As women have narrowed the labor force gap in the last few decades, education has been a vital catalyst. The 21st century has seen a notable increase in the education of women. Since 1997, the number of college-educated American women has increased by 115%, while the number of college-educated men has only increased by 85%. And higher-educated occupation areas are correlated with more female areas:
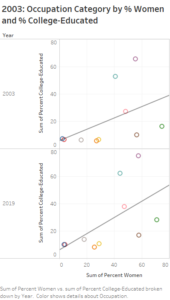
In this pair of graphs, the horizontal axis represents the concentration of women in the occupation area, and the vertical axis the concentration of college-educated workers.
As Georgetown University points out, however, the average economic value of a women’s education is still not equal to that of a man. Furthermore, on average, education is more critical for women’s employability than for men. Uneducated men are much more likely to find a well-paying union job in manufacturing than their female counterparts, and of course, a high percentage of uneducated women simply are not in the labor force. These trends are rooted in tradition, and even education has been hard-pressed to erase them. Time will tell whether women’s momentum in education continues in the coming years, but it seems certain that in an increasingly information-based economy, strides in education will only become more beneficial.
Sources:
https://www.bls.gov/cps/aa2003/cpsaat11.pdf
https://www.bls.gov/cps/cpsaat11.pdf
https://www.bls.gov/cps/cpsaat07.pdf
https://www.bls.gov/cps/aa2003/cpsaat7.pdf
https://cew.georgetown.edu/wp-content/uploads/Women_FR_Web.pdf
U.S. Bureau of Labor Statistics, Labor Force Participation Rate – Men [LNS11300001], retrieved from FRED, Federal Reserve Bank of St. Louis; https://fred.stlouisfed.org/series/LNS11300001, May 11, 2020.