Inside the Box: Visualizing Southern California’s Logistics Sector
In the wake of the great recession, the Inland Empire’s economy struggled to find its feet as the manufacturing and construction industries faltered. The story of the last ten years’ recovery is one of changes, as the Inland Empire’s economy has shifted towards jobs in healthcare, education, and, increasingly, logistics. In this new economy, Amazon reigns as the largest employer and warehouses line the highway for miles. Yet despite their economic importance, exactly what is inside these hulking structures and where the unending stream of trucks may be going remains a mystery to many. Deciphering these black boxes is key to understanding the factors driving today’s economy, and the risks that may be hidden in a newly logistics-dependent economy.
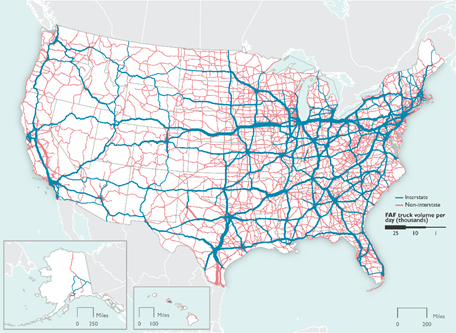
Fig 1: High cargo flows are funneled through Los Angeles by the interstate system. The Southern California highways corridor sees the most truck volume per day of any region west of Texas.
The rise of Southern California as a shipping and logistics hub arises primarily from its favorable geography. As one of the closest US cities to Asia, Los Angeles and Long Beach are attractive distribution hubs for goods crossing the pacific. With the continued rise of Asia’s manufacturing capability, it is not surprising that the California ports ranked first and second, respectively, among US ports for most shipping containers handled in 2018. In addition, the Sierra Nevada mountains and the interstate system act to funnel goods south through the greater Los Angeles Area, where I-5, I-10, and I-15 all meet. This has turned the greater LA area into the largest freight corridor in the western US. Utilizing data from the Bureau of Transportation Statistics, the Federal Highway Administration, and the Census Bureau, I’ve set out to explain these trends with interactive graphics.
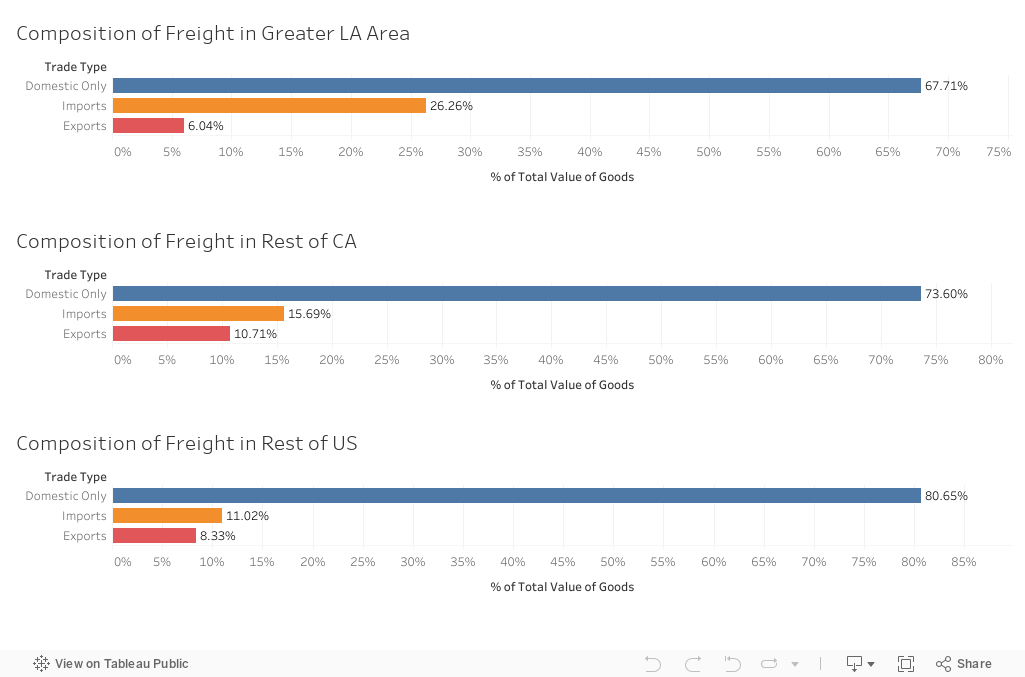
Due to the large ports, 30% of the goods that are transported from the greater LA area are imports, while 65% are of domestic origin. This is a stark contrast with the rest of California and the US, which only import goods at half the rate of LA. The implications of this on the average Southern Californian are mixed; LA and the Inland Empire will benefit from the infrastructure investment and job growth needed to support the distribution of goods to the rest of the US. However, these imports may undercut local producers, resulting in a shift in the employment composition of Southern California from higher paying manufacturing jobs towards lower paying logistics jobs. At the same time, macroeconomic theory suggests that imports incentivize economies to specialize their production in order to maintain a competitive advantage. This leads us back to our original question with added clarity: what is inside these freight containers, where are they headed, and do these trade flows show specialization of production in Southern California.

The graphic above displays the types of goods being transported from the five counties around LA and the states to which they are destined. Approximately two thirds of the goods transported in the greater LA area stay within California, and the majority of these goods are produced within the region. Three quarters of these intrastate flows fall within 6 commodity types: electronics, motor vehicles, fuels, mixed freight, textiles, and miscellaneous manufactured goods. While this may seem to be undiversified, nearly one fifth of the value of all goods shipped come from these mixed and miscellaneous categories, showing the strength of the region’s small businesses. Even better news, domestically produced high value products like electronics, pharmaceuticals, and motor vehicles make up one quarter of the flows. These statistics prove that high tech manufacturing jobs still exist in the greater LA area, even with competition from foreign producers.
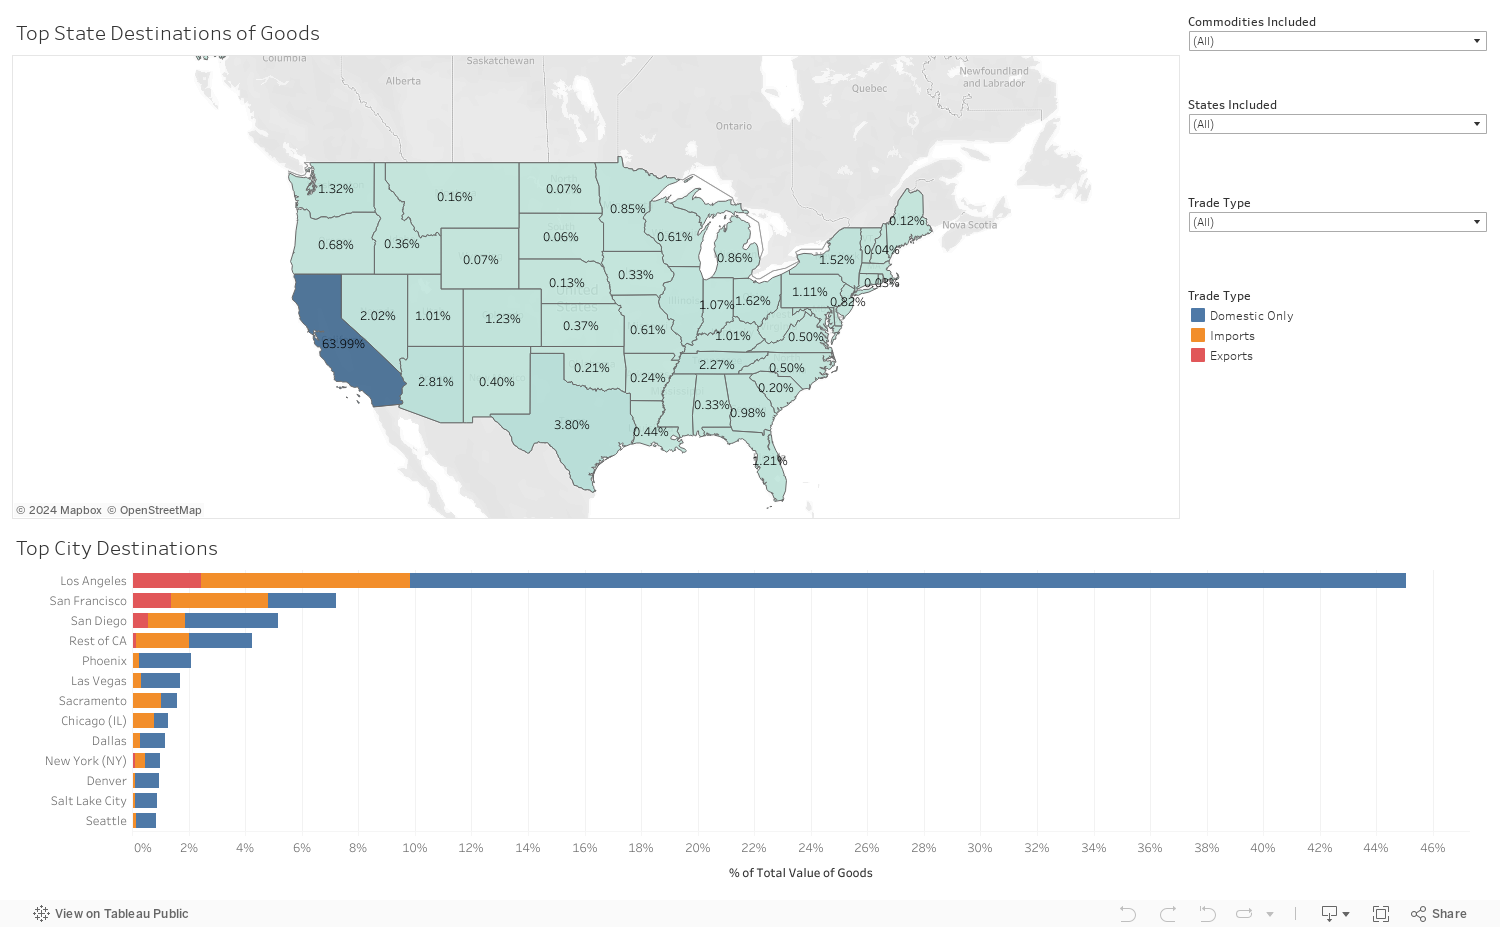
So where are these goods going? Nearly 45% of them are delivered to households and businesses within the greater LA area, and another 7% and 5% head to San Francisco and San Diego, respectively. Now, let’s examine California’s trading partners with our visualization. Under the “States Included” filter at the top of the Destinations of Goods dashboard, uncheck CA. Now it becomes clear that goods leaving from LA are delivered all over the country. Closer states, like Texas and Arizona receive the most goods, but significant amounts travel the entire country, to cities like New York and Atlanta.
Now, let’s dig a little deeper and select the motorized vehicles and parts industry to see if there are any trends. Oddly, Tennessee receives 10.6% of all vehicles and parts, the majority of which are imports. Perhaps this is because General Motors, Volkswagen, and Nissan all have factories in the state and need imported parts for assembly. Atlanta also has an unusually large amount of auto deliveries, but perhaps for a different reason. In 2012 the Georgia State House passed a bill which raised the cost of leasing cars, thus incentivizing car purchases. This is prime example of how interconnected both the economies and politics of far removed places are in today’s economy.
So where does this leave us? Even with the data we have, it is difficult to predict the net effect of this increasingly globalized economy on Southern California. At its core, the region still produces and consumes the majority of its goods locally, providing a base of economic stability. At the same time, goods which see declining demand during recessions, like fashion items and motor vehicles are also an important part of the cargo flowing through the greater LA region. But regardless of these fluctuations, two things are clear; Southern California’s logistics driven economy is here to stay, and so is the traffic.
——–
I encourage you to continue exploring these visualizations for odd trends and unexpected trade partnerships. As a starting point, I suggest looking at the destinations of Fertilizers, Metallic Ores, or Waste products. All show unusual behavior, and invite further investigation. Let me know what discoveries you make in the comment section below!