
In the early 2000s, a surge of Chinese exports threatened American manufacturing. Dubbed the “China Shock,” Chinese exports pressured American manufacturing through lower labor and material costs. Regions that depended on manufacturing, especially in the Midwest and South, saw sharp declines in employment, wages, and in some cases, population. Metropolitan Statistical Areas (MSAs) with narrow industrial specialization were particularly vulnerable to this shock, lacking the diversified economic base needed to absorb displaced workers. Job growth occurring in other sectors occurred in other places, and thus people moved.
This contrast reflects a broader economic principle: diversification is insurance against volatility. Similarly to how an investor diversifies their portfolio to hedge against downturns against any specific stock, diversification enables an MSA to soften the impact of sector-specific shocks, as when one industry is impacted, another can absorb and employ that displaced labor force. Cities that rose with and rely on a single industry may fall if that industry loses its comparative advantage. Detroit, for example, was once the automobile capital of the world, until the auto industry faced contraction and foreign competition, resulting in the city’s precipitous decline. Rochester revolved around Eastman Kodak, but as digital cameras quickly overtook physical film, the city struggled to pivot. Large metropolises like Los Angeles faced major losses in the defense sector after the Cold War, but unlike the former two cities, their dominance in media and technology allowed them to reposition more effectively.
Population change is a vital indicator of an MSA’s economic success—people migrate to jobs. For policymakers, it is crucial to monitor these population growth rates, as they govern labor markets, housing needs, tax bases, infrastructure, and a host of other factors. Conversely, shrinking populations results in less labor to allow for a diverse industrial base, which could entrench stagnation and constrain public finances and economic development. The lasting effects of the China shock motivates our question: does the degree to which a city’s employment is concentrated within a few industries play a central role in shaping long-term population trends?
To investigate, I used employment data by industry from the Bureau of Labor Statistics during 1990 and 2024 per MSA to calculate the Krugman Specialization Index (KSI), a value that represents the industrial diversity of an MSA on a scale from zero to one. Values closer to zero represent a more diverse spread, while values closer to one suggest an MSA is highly specialized in a small number of industries and thus vulnerable to industry-specific shocks. I calculated this at the very granular five and six-digit North American Industry Classification System level, thereby separately identifying narrowly defined industries, such as distinguishing between the supermarket industry and the convenience store industry. Working at this level implicitly assumes that competitive shocks operate narrowly—that an outside competitor might suddenly threaten local grocery stores but not convenience stores, allowing a city that has both to shift from one to the other. After calculating this value for every MSA at the 1990 cross section by using over 600 industries, I regressed population growth over the subsequent 34 years on both KSI and the change in KSI.
Prior work on city growth has identified several key factors beyond diversification. Harvard economist Edward Glaeser famously observed that “human capital follows the thermometer.” He documented that as the United States transitioned from a manufacturing-centric economy to a services and knowledge-based economy, high-skilled human capital migrated towards the Sun Belt. As warmer MSAs like the Austin, Texas and Phoenix, Arizona metropolitan areas surged, manufacturing-based metropolitan areas in the Northeast and Midwest stagnated. Given that human capital trended towards warmer areas as the US transitioned to a services-based economy, I included both educational attainment and weather as controls so as to determine whether industrial diversification affects growth independently of these established forces.
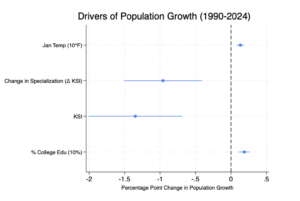
Figure 1: Drivers of Population Growth from 1990 to 2024
Figure 1 indicates that all of these factors were significant at the 1% level, and together explain around 12.1% of MSA-to-MSA variation from 1990-2024, which is impressive predictive power from just four variables for population growth. As expected, the coefficients for January temperature and educational attainment are positive and statistically significant, cleanly reproducing Glaeser’s findings. However, even after these effects are accounted for, industrial diversity still remains a powerful predictor of population growth. The data work confirms the hypothesis: cities which began the period more specialized grew more slowly than cities with a broader industrial base. Moreover, cities that became more specialized over the period grew more slowly still.
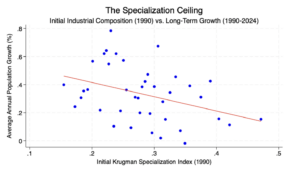
Figure 2: The Growth Ceiling of MSAs based on Initial Specialization
Figure 2 builds on this statistical significance by visualizing the magnitude of this effect through a binned scatterplot. The 330 MSAs are condensed into around 40 equal-sized bins grouped by their initial KSI and represented by the data points on the plot. The effect is evident: MSAs with higher initial specialization grew more slowly over the next three decades. Thus, fostering industrial diversification is a key tactic for cities seeking to maintain a robust population base to match infrastructure and maintain city finances. By prioritizing industrial diversity, local leaders can position their region to best capitalize on future waves of technological and economic evolution.
Article by Arnav Swamy
Data Journalist